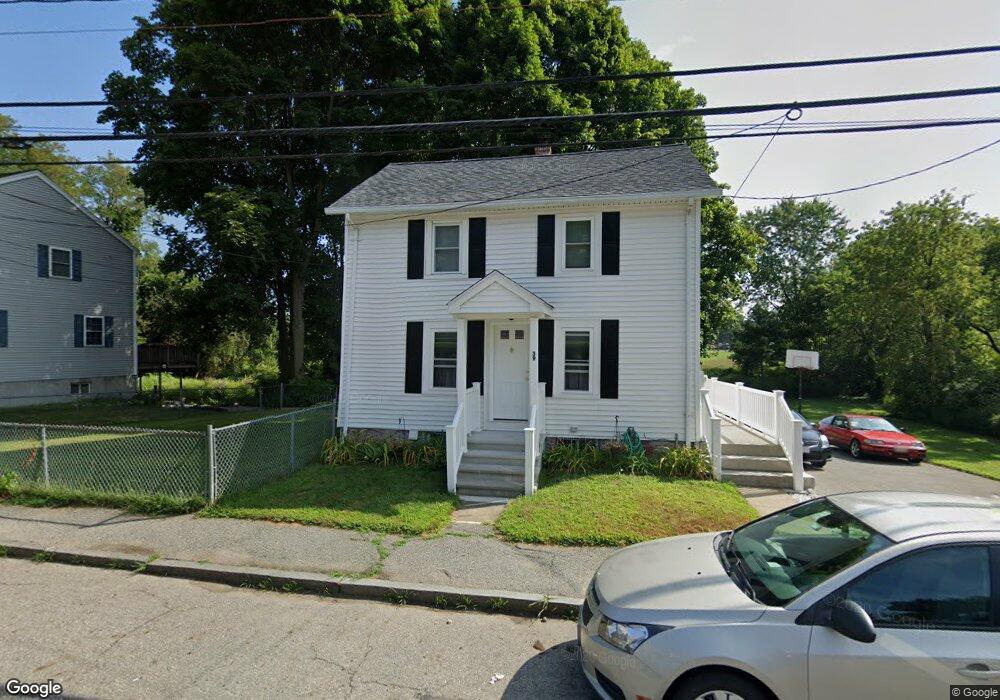
39 N Warren St Woburn, MA 01801
Downtown Woburn NeighborhoodEstimated Value: $510,000 - $660,000
2
Beds
1
Bath
1,000
Sq Ft
$593/Sq Ft
Est. Value
About This Home
This home is located at 39 N Warren St, Woburn, MA 01801 and is currently estimated at $593,270, approximately $593 per square foot. 39 N Warren St is a home located in Middlesex County with nearby schools including Hurld Elementary School, Daniel L. Joyce Middle School, and Woburn High School.
Ownership History
Date
Name
Owned For
Owner Type
Purchase Details
Closed on
Apr 29, 2004
Sold by
Cialdea Frederick C
Bought by
Detomasi Marie L and Demacedo Susan
Current Estimated Value
Home Financials for this Owner
Home Financials are based on the most recent Mortgage that was taken out on this home.
Original Mortgage
$325,000
Outstanding Balance
$150,877
Interest Rate
5.36%
Mortgage Type
Purchase Money Mortgage
Estimated Equity
$442,393
Purchase Details
Closed on
Dec 15, 2003
Sold by
Carr Patricia G and Carr Charles R
Bought by
Cialdea Frederick C
Purchase Details
Closed on
Jan 5, 1999
Sold by
Carr Frederick L
Bought by
Carr Charles R and Carr Patricia G
Create a Home Valuation Report for This Property
The Home Valuation Report is an in-depth analysis detailing your home's value as well as a comparison with similar homes in the area
Home Values in the Area
Average Home Value in this Area
Purchase History
| Date | Buyer | Sale Price | Title Company |
|---|---|---|---|
| Detomasi Marie L | $200,000 | -- | |
| Detomasi Marie L | $200,000 | -- | |
| Cialdea Frederick C | $100,000 | -- | |
| Cialdea Frederick C | $100,000 | -- | |
| Carr Charles R | $121,800 | -- |
Source: Public Records
Mortgage History
| Date | Status | Borrower | Loan Amount |
|---|---|---|---|
| Open | Carr Charles R | $100,000 | |
| Open | Detomasi Marie L | $325,000 | |
| Closed | Carr Charles R | $325,000 |
Source: Public Records
Tax History
| Year | Tax Paid | Tax Assessment Tax Assessment Total Assessment is a certain percentage of the fair market value that is determined by local assessors to be the total taxable value of land and additions on the property. | Land | Improvement |
|---|---|---|---|---|
| 2025 | $4,521 | $529,400 | $310,000 | $219,400 |
| 2024 | $4,025 | $499,400 | $295,300 | $204,100 |
| 2023 | $4,032 | $463,400 | $268,500 | $194,900 |
| 2022 | $3,851 | $412,300 | $233,700 | $178,600 |
| 2021 | $6,374 | $380,800 | $222,700 | $158,100 |
| 2020 | $3,540 | $379,800 | $222,700 | $157,100 |
| 2019 | $5,963 | $361,100 | $212,200 | $148,900 |
| 2018 | $3,251 | $328,700 | $194,900 | $133,800 |
| 2017 | $5,111 | $301,000 | $185,700 | $115,300 |
| 2016 | $2,848 | $283,400 | $173,700 | $109,700 |
| 2015 | $2,731 | $268,500 | $162,400 | $106,100 |
| 2014 | $2,686 | $257,300 | $162,400 | $94,900 |
Source: Public Records
Map
Nearby Homes
- 80 N Warren St Unit 30
- 80 N Warren St Unit 31
- 52 Pleasant St
- 15 Hillside Ave
- 26 Flagg St
- 27 Arlington Rd Unit 2
- 31 Arlington Rd Unit 1-6
- 29 Arlington Rd Unit 3-2
- 29 Arlington Rd Unit 5
- 477 Main St
- 17 Wright St
- 7 Prospect St
- 21 Chestnut St
- 15 Sturgis St
- 31 Montvale Ave Unit 2
- 35 Montvale Ave Unit 8
- 555 Main St Unit 11
- 14 Church Ave
- 4 Gangi Terrace
- 18 Church St Unit 2
Your Personal Tour Guide
Ask me questions while you tour the home.