39 Naniuka Place Makawao, HI 96768
Estimated Value: $536,000 - $592,000
3
Beds
3
Baths
1,536
Sq Ft
$361/Sq Ft
Est. Value
About This Home
This home is located at 39 Naniuka Place, Makawao, HI 96768 and is currently estimated at $554,816, approximately $361 per square foot. 39 Naniuka Place is a home located in Maui County with nearby schools including Makawao Elementary School, Samuel Enoka Kalama Intermediate School, and King Kekaulike High School.
Ownership History
Date
Name
Owned For
Owner Type
Purchase Details
Closed on
Dec 27, 2005
Sold by
Hoopai John Janto and Hoopai Lorelei
Bought by
Ohst David Gerald and Ohst Brenda Lynn
Current Estimated Value
Home Financials for this Owner
Home Financials are based on the most recent Mortgage that was taken out on this home.
Original Mortgage
$200,000
Outstanding Balance
$113,013
Interest Rate
6.36%
Mortgage Type
New Conventional
Estimated Equity
$441,803
Purchase Details
Closed on
Oct 28, 2002
Sold by
Makekau Stanley N B and Makekau Stanley
Bought by
Makekau Jeffery N
Purchase Details
Closed on
Feb 27, 1996
Sold by
Murai Daryn Kiyoshi and Murai Sheri Keiko
Bought by
Hoopai John Janto and Hoopai Lorelei
Home Financials for this Owner
Home Financials are based on the most recent Mortgage that was taken out on this home.
Original Mortgage
$50,000
Interest Rate
7.04%
Create a Home Valuation Report for This Property
The Home Valuation Report is an in-depth analysis detailing your home's value as well as a comparison with similar homes in the area
Home Values in the Area
Average Home Value in this Area
Purchase History
| Date | Buyer | Sale Price | Title Company |
|---|---|---|---|
| Ohst David Gerald | $297,000 | Tg | |
| Makekau Jeffery N | -- | -- | |
| Hoopai John Janto | $166,000 | -- |
Source: Public Records
Mortgage History
| Date | Status | Borrower | Loan Amount |
|---|---|---|---|
| Open | Ohst David Gerald | $200,000 | |
| Previous Owner | Hoopai John Janto | $50,000 |
Source: Public Records
Tax History Compared to Growth
Tax History
| Year | Tax Paid | Tax Assessment Tax Assessment Total Assessment is a certain percentage of the fair market value that is determined by local assessors to be the total taxable value of land and additions on the property. | Land | Improvement |
|---|---|---|---|---|
| 2025 | $300 | $372,500 | $75,700 | $296,800 |
| 2024 | $300 | $351,100 | $66,200 | $284,900 |
| 2023 | $300 | $352,500 | $66,200 | $286,300 |
| 2022 | $350 | $317,100 | $56,700 | $260,400 |
| 2021 | $350 | $296,400 | $48,400 | $248,000 |
| 2020 | $400 | $314,700 | $60,600 | $254,100 |
| 2019 | $400 | $321,200 | $88,800 | $232,400 |
| 2018 | $400 | $298,100 | $88,800 | $209,300 |
| 2017 | $400 | $0 | $0 | $0 |
| 2016 | $3 | $261,800 | $64,600 | $197,200 |
| 2015 | -- | $243,300 | $64,600 | $178,700 |
Source: Public Records
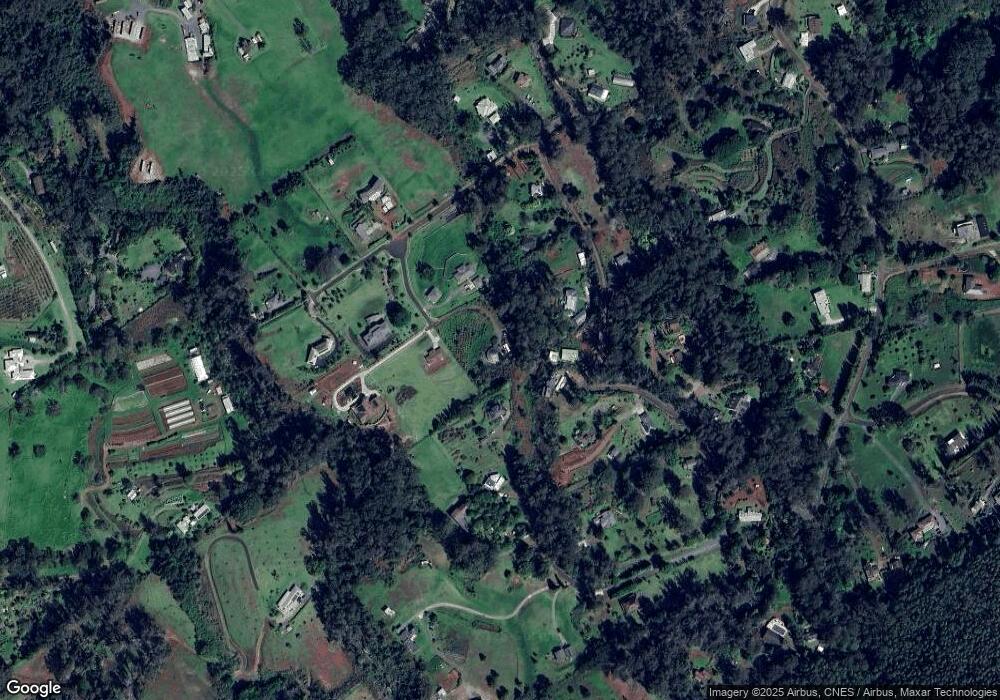
Map
Nearby Homes
- 2450 Piiholo Rd
- 1065 Ehu Rd
- 0 Makanoe Place
- 1733 Piiholo Rd
- 15 Olinda Rd
- 1365 Piiholo Rd
- 1180 Olinda Rd
- 1074 Olinda Rd Unit B
- 0 Makana Rd
- 450 Hoopalua Dr
- 0 Haleakala Hwy Unit B 406215
- 200 Hoopalua Dr
- 128 Hoopalua Dr
- 151 Aulii Dr
- 82 Upper Kimo Dr
- 47 Ka Dr
- 1115 Pookela Rd Unit A
- 39 Ka Dr
- 1123 Kehau Place
- 720 Kekona Place
- 39 Naniuka Place
- 2260 Piiholo Rd
- 43 Naniuka Place
- 43 Naniuka Place Unit Lot 181
- 2200 Piiholo Rd
- 35 Naniuka Place
- 2366 Piiholo Rd
- 55 Naniuka Place
- 2188 Piiholo Rd Unit B
- 2290 Piiholo Rd
- 47 Naniuka Place
- 47 Naniuka Place Unit Lot 4
- 2199 Piiholo Rd
- 2190 Piiholo Rd
- 2190 Piiholo Rd Unit A
- 2370 Piiholo Rd
- 40 Naniuka Place
- 2350 Piiholo Rd
- 50 Naniuka Place
- 2140 Piiholo Rd