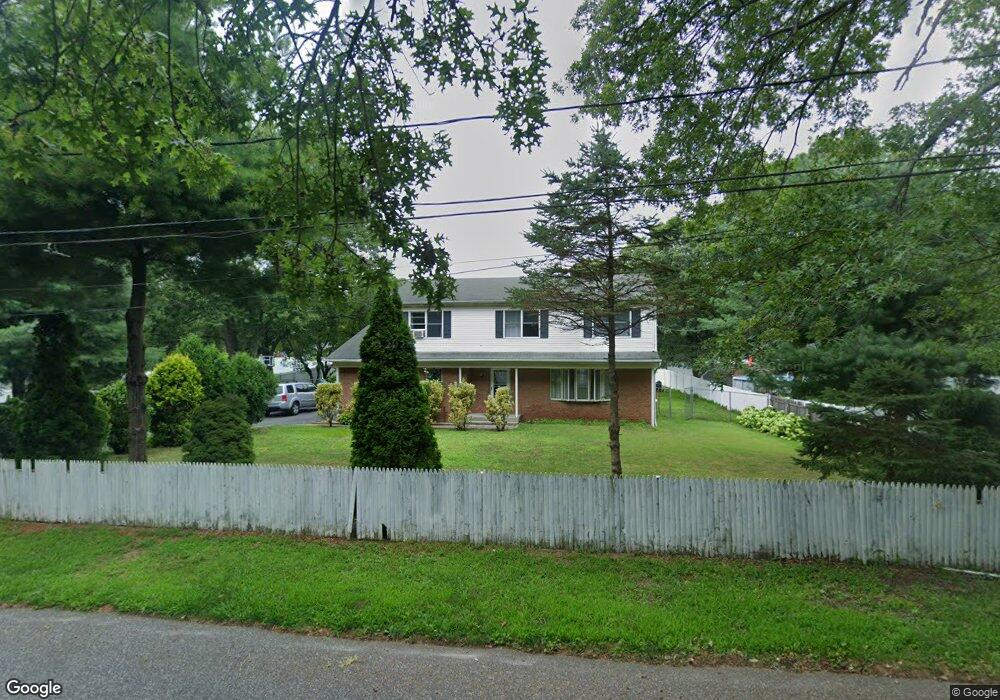
39 Nelson Rd Selden, NY 11784
Estimated Value: $630,000 - $716,000
4
Beds
4
Baths
2,223
Sq Ft
$308/Sq Ft
Est. Value
About This Home
This home is located at 39 Nelson Rd, Selden, NY 11784 and is currently estimated at $684,728, approximately $308 per square foot. 39 Nelson Rd is a home located in Suffolk County.
Ownership History
Date
Name
Owned For
Owner Type
Purchase Details
Closed on
Dec 11, 2015
Sold by
Rahman Syed S and Habib Rokeya
Bought by
Khan Mohammad M
Current Estimated Value
Home Financials for this Owner
Home Financials are based on the most recent Mortgage that was taken out on this home.
Original Mortgage
$294,566
Interest Rate
3.97%
Mortgage Type
New Conventional
Purchase Details
Closed on
Jan 28, 2002
Sold by
Prianti Frank and Prianti Deborah
Bought by
Rahman Syed S and Habib Rokeya
Home Financials for this Owner
Home Financials are based on the most recent Mortgage that was taken out on this home.
Original Mortgage
$271,000
Interest Rate
7.13%
Mortgage Type
Purchase Money Mortgage
Create a Home Valuation Report for This Property
The Home Valuation Report is an in-depth analysis detailing your home's value as well as a comparison with similar homes in the area
Home Values in the Area
Average Home Value in this Area
Purchase History
| Date | Buyer | Sale Price | Title Company |
|---|---|---|---|
| Khan Mohammad M | $300,000 | None Available | |
| Khan Mohammad M | $300,000 | None Available | |
| Rahman Syed S | $286,000 | -- | |
| Rahman Syed S | $286,000 | -- |
Source: Public Records
Mortgage History
| Date | Status | Borrower | Loan Amount |
|---|---|---|---|
| Previous Owner | Khan Mohammad M | $294,566 | |
| Previous Owner | Rahman Syed S | $271,000 |
Source: Public Records
Tax History
| Year | Tax Paid | Tax Assessment Tax Assessment Total Assessment is a certain percentage of the fair market value that is determined by local assessors to be the total taxable value of land and additions on the property. | Land | Improvement |
|---|---|---|---|---|
| 2024 | $12,269 | $2,730 | $350 | $2,380 |
| 2023 | $12,269 | $2,730 | $350 | $2,380 |
| 2022 | $11,163 | $2,730 | $350 | $2,380 |
| 2021 | $11,163 | $2,730 | $350 | $2,380 |
| 2020 | $11,392 | $2,730 | $350 | $2,380 |
| 2019 | $11,392 | $0 | $0 | $0 |
| 2018 | $10,913 | $2,730 | $350 | $2,380 |
| 2017 | $12,286 | $3,085 | $350 | $2,735 |
| 2016 | $12,233 | $3,085 | $350 | $2,735 |
| 2015 | -- | $3,085 | $350 | $2,735 |
| 2014 | -- | $3,550 | $350 | $3,200 |
Source: Public Records
Map
Nearby Homes
Your Personal Tour Guide
Ask me questions while you tour the home.