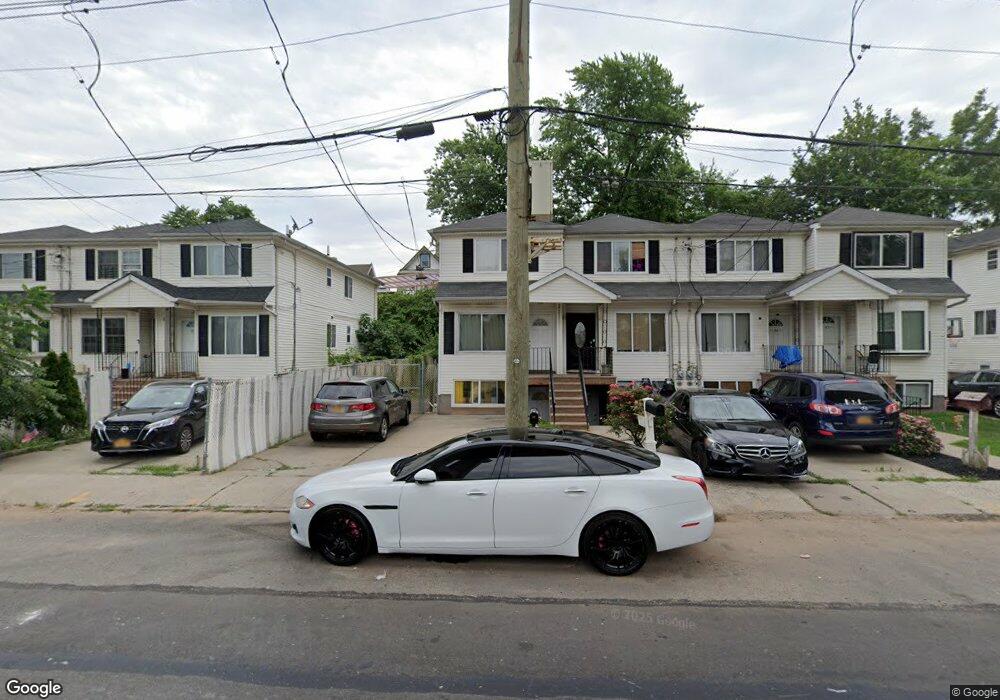
39 Newark Ave Staten Island, NY 10302
Port Richmond NeighborhoodEstimated Value: $551,000 - $562,000
3
Beds
3
Baths
1,800
Sq Ft
$309/Sq Ft
Est. Value
About This Home
This home is located at 39 Newark Ave, Staten Island, NY 10302 and is currently estimated at $556,267, approximately $309 per square foot. 39 Newark Ave is a home located in Richmond County with nearby schools including PS 21 Margaret Emery-Elm Park, I.S. 51 Edwin Markham, and Port Richmond High School.
Ownership History
Date
Name
Owned For
Owner Type
Purchase Details
Closed on
Sep 30, 2021
Sold by
Lofkoff Properties Llc
Bought by
P & G Silver Lake Llc
Current Estimated Value
Purchase Details
Closed on
Dec 15, 2011
Sold by
Foster Development Llc
Bought by
Lofkoff Properties Llc
Purchase Details
Closed on
Aug 23, 2011
Sold by
The Secretary Of Housing & Urban Develop
Bought by
Foster Development Llc
Purchase Details
Closed on
May 5, 2011
Sold by
Citimortgage Inc
Bought by
The Secretary Of Housing & Urban Develop
Purchase Details
Closed on
Sep 17, 2009
Sold by
Parker Latisha and Leary Mattie
Bought by
Citimortgage Inc
Purchase Details
Closed on
Jun 21, 2007
Sold by
Pearsal Avenue Builders Corp
Bought by
Parker Latisha and Leary Mattie
Home Financials for this Owner
Home Financials are based on the most recent Mortgage that was taken out on this home.
Original Mortgage
$443,000
Interest Rate
6.39%
Mortgage Type
FHA
Create a Home Valuation Report for This Property
The Home Valuation Report is an in-depth analysis detailing your home's value as well as a comparison with similar homes in the area
Home Values in the Area
Average Home Value in this Area
Purchase History
| Date | Buyer | Sale Price | Title Company |
|---|---|---|---|
| P & G Silver Lake Llc | -- | Ridge Abstract Corp | |
| Lofkoff Properties Llc | -- | None Available | |
| Foster Development Llc | $168,600 | None Available | |
| The Secretary Of Housing & Urban Develop | -- | Advantage Title Agency Inc | |
| Citimortgage Inc | $529,227 | None Available | |
| Parker Latisha | $450,000 | Old Republic National Title |
Source: Public Records
Mortgage History
| Date | Status | Borrower | Loan Amount |
|---|---|---|---|
| Previous Owner | Parker Latisha | $443,000 |
Source: Public Records
Tax History Compared to Growth
Tax History
| Year | Tax Paid | Tax Assessment Tax Assessment Total Assessment is a certain percentage of the fair market value that is determined by local assessors to be the total taxable value of land and additions on the property. | Land | Improvement |
|---|---|---|---|---|
| 2025 | $4,075 | $32,460 | $4,238 | $28,222 |
| 2024 | $4,075 | $26,520 | $5,188 | $21,332 |
| 2023 | $3,957 | $19,483 | $4,684 | $14,799 |
| 2022 | $3,669 | $22,920 | $6,780 | $16,140 |
| 2021 | $3,649 | $18,960 | $6,780 | $12,180 |
| 2020 | $3,579 | $19,980 | $6,780 | $13,200 |
| 2019 | $3,537 | $21,660 | $6,780 | $14,880 |
| 2018 | $3,310 | $16,236 | $4,999 | $11,237 |
| 2017 | $3,123 | $15,318 | $5,342 | $9,976 |
| 2016 | $2,889 | $14,451 | $4,286 | $10,165 |
| 2015 | $2,704 | $14,091 | $3,817 | $10,274 |
| 2014 | $2,704 | $14,091 | $4,583 | $9,508 |
Source: Public Records
Map
Nearby Homes
- 28 Morningstar Rd
- 54 Riverside Dr Unit 1AA
- 162 John St
- 98 Saint Josephs Ave
- 209 Nicholas Ave
- 145 Morningside Ave Unit 2C
- 231 Charles Ave
- 121 Harrison Ave
- 27 Wright Ave
- 145 Clinton Place
- 211 Morningstar Rd
- 1594 Castleton Ave
- 21 Simonson Ave
- 17 Sharpe Ave
- 70 Grove Ave
- 12 Simonson Ave
- 111 Faber St
- 0 Larkin St
- 38 Laforge Ave
- 152 Port Richmond Ave