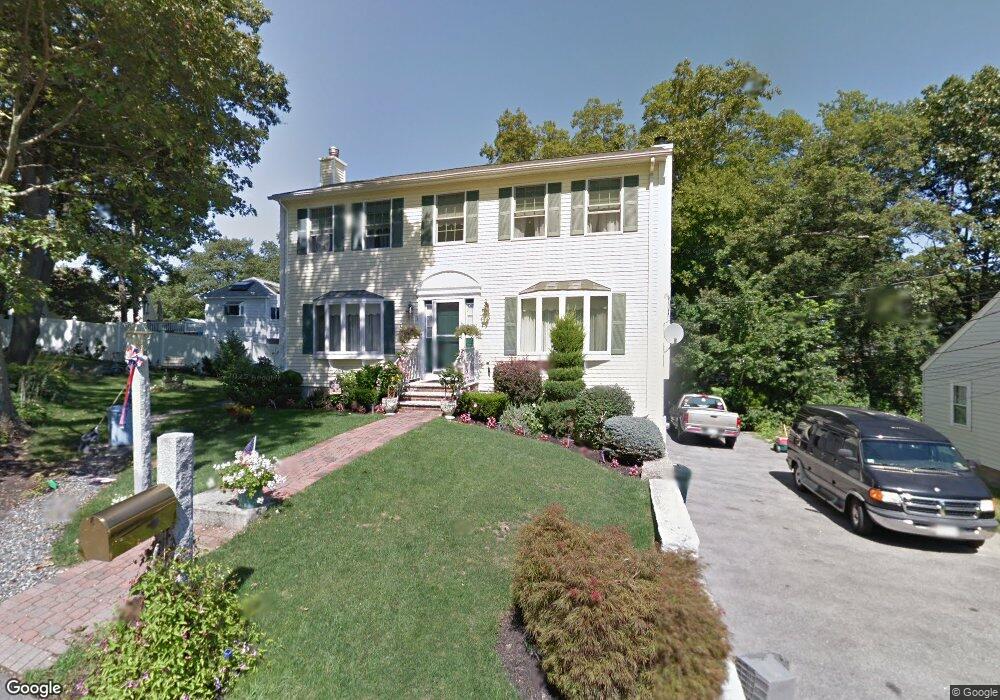
39 Oak Ave Peabody, MA 01960
South Peabody NeighborhoodEstimated Value: $850,000 - $868,252
4
Beds
4
Baths
2,216
Sq Ft
$388/Sq Ft
Est. Value
About This Home
This home is located at 39 Oak Ave, Peabody, MA 01960 and is currently estimated at $859,563, approximately $387 per square foot. 39 Oak Ave is a home located in Essex County with nearby schools including Peabody Veterans Memorial High School.
Ownership History
Date
Name
Owned For
Owner Type
Purchase Details
Closed on
Mar 20, 2017
Sold by
Benson John L and Benson Patricia A
Bought by
Kaplan Benjamin and Kaplan Nicole T
Current Estimated Value
Home Financials for this Owner
Home Financials are based on the most recent Mortgage that was taken out on this home.
Original Mortgage
$420,750
Outstanding Balance
$340,981
Interest Rate
3.38%
Mortgage Type
New Conventional
Estimated Equity
$518,582
Create a Home Valuation Report for This Property
The Home Valuation Report is an in-depth analysis detailing your home's value as well as a comparison with similar homes in the area
Home Values in the Area
Average Home Value in this Area
Purchase History
| Date | Buyer | Sale Price | Title Company |
|---|---|---|---|
| Kaplan Benjamin | $495,000 | -- |
Source: Public Records
Mortgage History
| Date | Status | Borrower | Loan Amount |
|---|---|---|---|
| Open | Kaplan Benjamin | $420,750 |
Source: Public Records
Tax History
| Year | Tax Paid | Tax Assessment Tax Assessment Total Assessment is a certain percentage of the fair market value that is determined by local assessors to be the total taxable value of land and additions on the property. | Land | Improvement |
|---|---|---|---|---|
| 2025 | $7,071 | $763,600 | $220,000 | $543,600 |
| 2024 | $6,597 | $723,400 | $220,000 | $503,400 |
| 2023 | $6,113 | $642,100 | $196,500 | $445,600 |
| 2022 | $5,961 | $590,200 | $175,500 | $414,700 |
| 2021 | $5,775 | $550,500 | $159,500 | $391,000 |
| 2020 | $5,904 | $549,700 | $159,500 | $390,200 |
| 2019 | $5,440 | $494,100 | $159,500 | $334,600 |
| 2018 | $5,478 | $478,000 | $145,000 | $333,000 |
| 2017 | $4,913 | $417,800 | $145,000 | $272,800 |
| 2016 | $4,704 | $394,600 | $145,000 | $249,600 |
| 2015 | $4,966 | $403,700 | $141,400 | $262,300 |
Source: Public Records
Map
Nearby Homes
- 12 Tara Rd
- 11 Pulver Dr
- 43 Gedney Dr
- 21 Oak Leaf Way
- 6 Allen Rd
- 26 Bartholomew Terrace
- 325 Den Quarry Rd
- 217 Cedar Brook Rd
- 233 Bartholomew St
- 54 Harris Rd
- 333 Lynnfield St
- 13 Ralph Rd
- 2 Anchor Rd
- 30 Longwood Rd
- 38 Longview Way
- 3 Margaret Rd
- 9 Hermon Rd
- 275 Lynnfield St Unit 275
- 9 Sutcliffe Rd
- 75 Park Rd
Your Personal Tour Guide
Ask me questions while you tour the home.