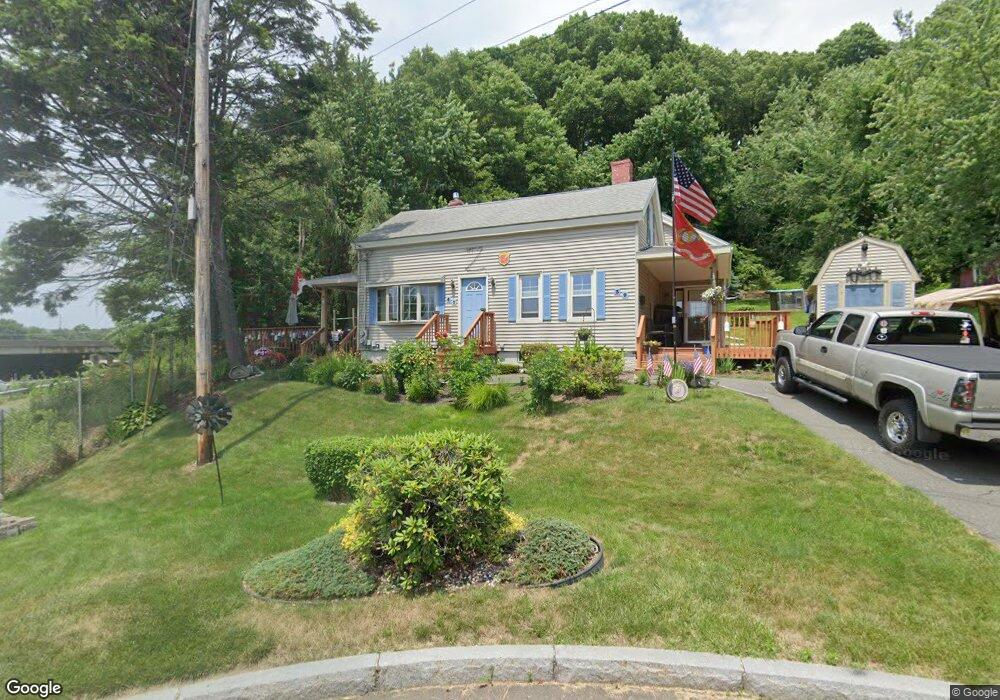
39 Old Chicopee St Chicopee, MA 01013
Sandy Hill NeighborhoodEstimated Value: $295,000 - $373,000
2
Beds
2
Baths
900
Sq Ft
$380/Sq Ft
Est. Value
About This Home
This home is located at 39 Old Chicopee St, Chicopee, MA 01013 and is currently estimated at $342,384, approximately $380 per square foot. 39 Old Chicopee St is a home located in Hampden County with nearby schools including Barry Elementary School, Bellamy Middle School, and Chicopee High School.
Ownership History
Date
Name
Owned For
Owner Type
Purchase Details
Closed on
Jun 30, 2010
Sold by
Zabik James M
Bought by
Zabik James M and Zabik Liani T
Current Estimated Value
Home Financials for this Owner
Home Financials are based on the most recent Mortgage that was taken out on this home.
Original Mortgage
$40,000
Outstanding Balance
$26,564
Interest Rate
4.63%
Estimated Equity
$315,820
Purchase Details
Closed on
Feb 12, 1992
Sold by
Zabik Bertha
Bought by
Zabik James M
Create a Home Valuation Report for This Property
The Home Valuation Report is an in-depth analysis detailing your home's value as well as a comparison with similar homes in the area
Home Values in the Area
Average Home Value in this Area
Purchase History
| Date | Buyer | Sale Price | Title Company |
|---|---|---|---|
| Zabik James M | -- | -- | |
| Zabik James M | $10,000 | -- |
Source: Public Records
Mortgage History
| Date | Status | Borrower | Loan Amount |
|---|---|---|---|
| Open | Zabik James M | $40,000 |
Source: Public Records
Tax History Compared to Growth
Tax History
| Year | Tax Paid | Tax Assessment Tax Assessment Total Assessment is a certain percentage of the fair market value that is determined by local assessors to be the total taxable value of land and additions on the property. | Land | Improvement |
|---|---|---|---|---|
| 2025 | $4,175 | $275,400 | $116,400 | $159,000 |
| 2024 | $3,900 | $264,200 | $114,200 | $150,000 |
| 2023 | $3,594 | $237,200 | $103,900 | $133,300 |
| 2022 | $3,430 | $201,900 | $90,300 | $111,600 |
| 2021 | $5,147 | $183,400 | $82,100 | $101,300 |
| 2020 | $3,129 | $179,200 | $84,300 | $94,900 |
| 2019 | $3,127 | $174,100 | $84,300 | $89,800 |
| 2018 | $5,093 | $166,500 | $80,300 | $86,200 |
| 2017 | $3,152 | $182,100 | $73,500 | $108,600 |
| 2016 | $3,059 | $180,900 | $73,500 | $107,400 |
| 2015 | $3,027 | $172,600 | $73,500 | $99,100 |
| 2014 | $1,514 | $172,600 | $73,500 | $99,100 |
Source: Public Records
Map
Nearby Homes
- 35 Old Chicopee St
- 35 Old Chicopee St Unit A
- 33 Old Chicopee St
- 33 Old Chicopee St Unit 33
- 31-33 Old Chicopee St
- 31 Old Chicopee St Unit 33
- 8 Dwight Terrace
- 27 Old Chicopee St
- 2 Coolidge Rd
- 13 Dwight Terrace
- 8 Coolidge Rd
- 1 Coolidge Rd
- 12 Coolidge Rd
- 5 Coolidge Rd
- 2B Gardner Rd
- 9 Coolidge Rd
- 2 Gardner Rd
- 6 Gardner Rd
- lot 2 Hooper Rd
- lot 1 Hooper Rd