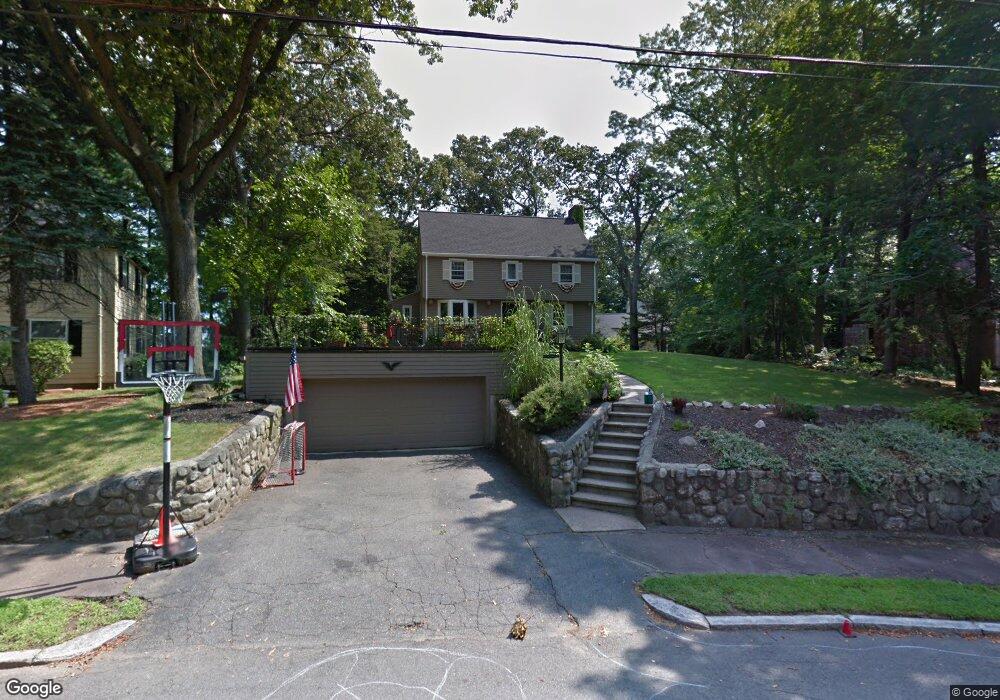
39 Outlook Rd Wakefield, MA 01880
West Side NeighborhoodEstimated Value: $1,091,000 - $1,352,000
3
Beds
3
Baths
3,269
Sq Ft
$376/Sq Ft
Est. Value
About This Home
This home is located at 39 Outlook Rd, Wakefield, MA 01880 and is currently estimated at $1,229,522, approximately $376 per square foot. 39 Outlook Rd is a home located in Middlesex County with nearby schools including Wakefield Memorial High School, St Joseph School, and St. Patrick Elementary School.
Ownership History
Date
Name
Owned For
Owner Type
Purchase Details
Closed on
Aug 11, 2010
Sold by
Staples Mark H and Staples Michele A
Bought by
Mondello Michael J and Mondello Nicole A
Current Estimated Value
Home Financials for this Owner
Home Financials are based on the most recent Mortgage that was taken out on this home.
Original Mortgage
$453,920
Outstanding Balance
$301,447
Interest Rate
4.63%
Mortgage Type
Purchase Money Mortgage
Estimated Equity
$928,075
Create a Home Valuation Report for This Property
The Home Valuation Report is an in-depth analysis detailing your home's value as well as a comparison with similar homes in the area
Home Values in the Area
Average Home Value in this Area
Purchase History
| Date | Buyer | Sale Price | Title Company |
|---|---|---|---|
| Mondello Michael J | $567,400 | -- |
Source: Public Records
Mortgage History
| Date | Status | Borrower | Loan Amount |
|---|---|---|---|
| Open | Mondello Michael J | $453,920 |
Source: Public Records
Tax History
| Year | Tax Paid | Tax Assessment Tax Assessment Total Assessment is a certain percentage of the fair market value that is determined by local assessors to be the total taxable value of land and additions on the property. | Land | Improvement |
|---|---|---|---|---|
| 2025 | $12,246 | $1,078,900 | $412,900 | $666,000 |
| 2024 | $11,784 | $1,047,500 | $400,800 | $646,700 |
| 2023 | $11,385 | $970,600 | $371,100 | $599,500 |
| 2022 | $10,882 | $883,300 | $337,400 | $545,900 |
| 2021 | $10,451 | $821,000 | $313,800 | $507,200 |
| 2020 | $10,050 | $787,000 | $300,800 | $486,200 |
| 2019 | $9,750 | $759,900 | $290,500 | $469,400 |
| 2018 | $9,227 | $712,500 | $272,300 | $440,200 |
| 2017 | $8,695 | $667,300 | $259,400 | $407,900 |
| 2016 | $8,157 | $604,700 | $240,000 | $364,700 |
| 2015 | $7,626 | $565,700 | $224,300 | $341,400 |
| 2014 | $7,010 | $548,500 | $217,400 | $331,100 |
Source: Public Records
Map
Nearby Homes
- 80 Redfield Rd
- 2 Summit Dr Unit 43
- 1 Summit Dr Unit 57
- 403 Gazebo Cir
- 311 Gazebo Cir Unit 311
- 95 Prospect St
- 1014 Gazebo Cir Unit 1014
- 4 Adams St
- 241 Main St Unit C3
- 64 Main St Unit 24B
- 12 Isola Ln
- 66 Main St Unit 15A
- 68 Main St Unit 21C
- 20 Pinevale Ave
- 50 Quannapowitt Pkwy
- 313 South St
- 248 Albion St Unit 231
- 248 Albion St Unit 321
- 75 Augustus Ct Unit 2003
- 62 High St Unit Lot 8
Your Personal Tour Guide
Ask me questions while you tour the home.