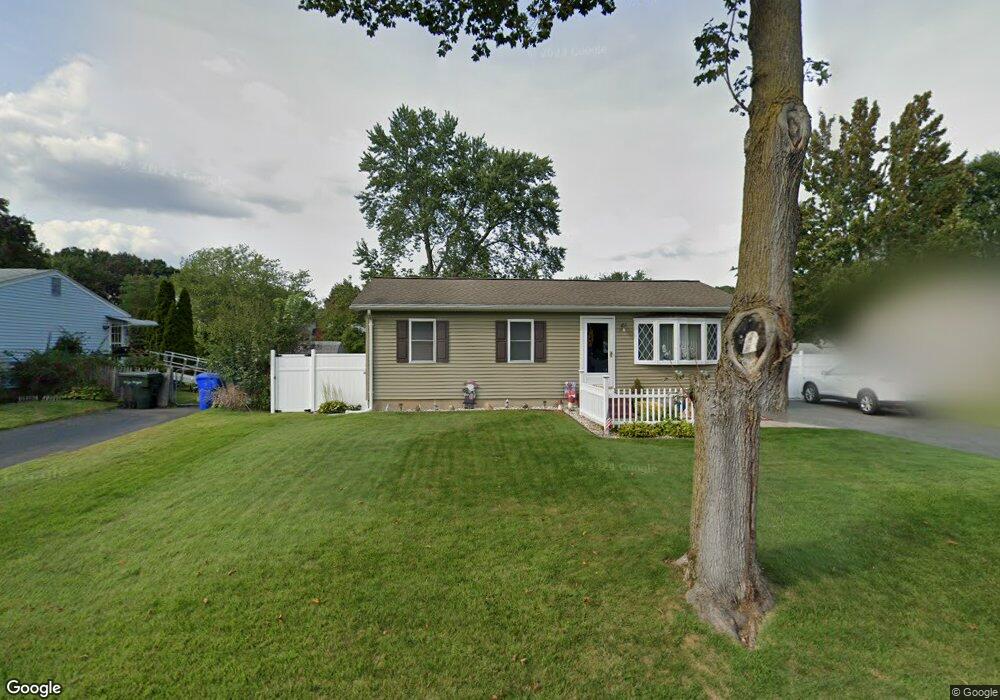
39 Partridge Dr Springfield, MA 01119
Sixteen Acres NeighborhoodEstimated Value: $280,000 - $312,000
3
Beds
1
Bath
864
Sq Ft
$339/Sq Ft
Est. Value
About This Home
This home is located at 39 Partridge Dr, Springfield, MA 01119 and is currently estimated at $293,090, approximately $339 per square foot. 39 Partridge Dr is a home located in Hampden County with nearby schools including Mary M. Lynch Elementary School, John J Duggan Middle, and Springfield Central High School.
Ownership History
Date
Name
Owned For
Owner Type
Purchase Details
Closed on
Apr 11, 2007
Sold by
Drisdelle John P and Crum Michael J
Bought by
Costa Antonio and Costa Ana M
Current Estimated Value
Home Financials for this Owner
Home Financials are based on the most recent Mortgage that was taken out on this home.
Original Mortgage
$132,000
Outstanding Balance
$80,205
Interest Rate
6.24%
Mortgage Type
Purchase Money Mortgage
Estimated Equity
$212,885
Purchase Details
Closed on
Apr 7, 2006
Sold by
Fitzgibbon Kenneth
Bought by
Drisdelle John P and Crum Michael J
Purchase Details
Closed on
Mar 24, 2006
Sold by
Reo Mgmt 2004 Inc
Bought by
Fitzgibbon Kenneth
Purchase Details
Closed on
Jul 8, 2005
Sold by
Sfjv 2004-1 Llc and Chenevert James K
Bought by
Reo Mgmt Inc
Purchase Details
Closed on
Oct 1, 2002
Sold by
Oconnor Ann
Bought by
Chenevert James K and Chenevert Lori A
Home Financials for this Owner
Home Financials are based on the most recent Mortgage that was taken out on this home.
Original Mortgage
$117,000
Interest Rate
6.25%
Mortgage Type
Purchase Money Mortgage
Create a Home Valuation Report for This Property
The Home Valuation Report is an in-depth analysis detailing your home's value as well as a comparison with similar homes in the area
Home Values in the Area
Average Home Value in this Area
Purchase History
| Date | Buyer | Sale Price | Title Company |
|---|---|---|---|
| Costa Antonio | $165,000 | -- | |
| Drisdelle John P | $115,000 | -- | |
| Fitzgibbon Kenneth | -- | -- | |
| Reo Mgmt Inc | $114,750 | -- | |
| Chenevert James K | $118,000 | -- |
Source: Public Records
Mortgage History
| Date | Status | Borrower | Loan Amount |
|---|---|---|---|
| Open | Costa Antonio | $132,000 | |
| Closed | Costa Antonio | $16,000 | |
| Previous Owner | Chenevert James K | $117,000 |
Source: Public Records
Tax History Compared to Growth
Tax History
| Year | Tax Paid | Tax Assessment Tax Assessment Total Assessment is a certain percentage of the fair market value that is determined by local assessors to be the total taxable value of land and additions on the property. | Land | Improvement |
|---|---|---|---|---|
| 2025 | $3,605 | $229,900 | $51,600 | $178,300 |
| 2024 | $3,455 | $215,100 | $51,600 | $163,500 |
| 2023 | $3,272 | $191,900 | $49,200 | $142,700 |
| 2022 | $3,241 | $172,200 | $49,200 | $123,000 |
| 2021 | $2,784 | $147,300 | $44,700 | $102,600 |
| 2020 | $2,869 | $146,900 | $44,700 | $102,200 |
| 2019 | $2,582 | $131,200 | $44,700 | $86,500 |
| 2018 | $2,702 | $137,300 | $44,700 | $92,600 |
| 2017 | $2,629 | $133,700 | $44,400 | $89,300 |
| 2016 | $2,467 | $125,500 | $44,400 | $81,100 |
| 2015 | $2,394 | $121,700 | $44,400 | $77,300 |
Source: Public Records
Map
Nearby Homes
- 6 Sparrow Dr
- 21 Meadowlark Ln
- 381 N Brook Rd
- 35 Juniper Dr
- 156 Gardens Dr
- 222 Bolton St
- 73 Catalpa Terrace
- 98 Granger St
- 74 Blanche St
- 57 Brewster St
- 55 Woodrow St
- 13 Granger St
- 908 Parker St
- 195 Almira Rd
- 15 Burns Ave
- 78 Pioneer Way
- 110 Lamplighter Ln Unit C
- 1130 Parker St
- Lot 37 Kane St
- 54 Pioneer Way