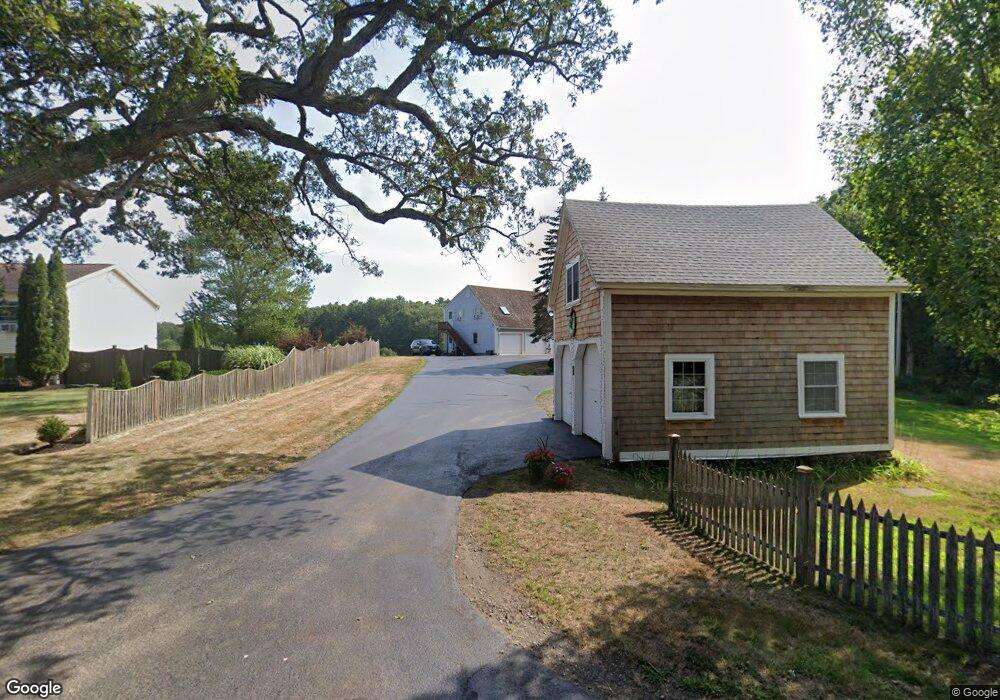
39 Peabody St Middleton, MA 01949
Estimated Value: $834,839 - $1,179,000
3
Beds
3
Baths
2,960
Sq Ft
$352/Sq Ft
Est. Value
About This Home
This home is located at 39 Peabody St, Middleton, MA 01949 and is currently estimated at $1,041,210, approximately $351 per square foot. 39 Peabody St is a home located in Essex County with nearby schools including Howe-Manning Elementary School, Fuller Meadow Elementary School, and Masconomet Regional Middle School.
Ownership History
Date
Name
Owned For
Owner Type
Purchase Details
Closed on
Sep 27, 2013
Sold by
Evans Paula M and Evans David G
Bought by
Aguiar Teresa and Aguiar Jose
Current Estimated Value
Home Financials for this Owner
Home Financials are based on the most recent Mortgage that was taken out on this home.
Original Mortgage
$391,960
Outstanding Balance
$292,724
Interest Rate
4.42%
Mortgage Type
New Conventional
Estimated Equity
$748,486
Purchase Details
Closed on
May 29, 2007
Sold by
Evans David G and Evans Paula M
Bought by
Evans Paula M
Create a Home Valuation Report for This Property
The Home Valuation Report is an in-depth analysis detailing your home's value as well as a comparison with similar homes in the area
Home Values in the Area
Average Home Value in this Area
Purchase History
| Date | Buyer | Sale Price | Title Company |
|---|---|---|---|
| Aguiar Teresa | $489,950 | -- | |
| Aguiar Teresa | $489,950 | -- | |
| Evans Paula M | -- | -- | |
| Evans Paula M | -- | -- |
Source: Public Records
Mortgage History
| Date | Status | Borrower | Loan Amount |
|---|---|---|---|
| Open | Evans Paula M | $391,960 |
Source: Public Records
Tax History
| Year | Tax Paid | Tax Assessment Tax Assessment Total Assessment is a certain percentage of the fair market value that is determined by local assessors to be the total taxable value of land and additions on the property. | Land | Improvement |
|---|---|---|---|---|
| 2025 | $9,030 | $759,500 | $349,800 | $409,700 |
| 2024 | $9,228 | $782,700 | $349,800 | $432,900 |
| 2023 | $7,393 | $574,400 | $245,300 | $329,100 |
| 2022 | $7,730 | $583,400 | $260,500 | $322,900 |
| 2021 | $7,886 | $574,800 | $269,300 | $305,500 |
| 2020 | $7,876 | $578,300 | $269,300 | $309,000 |
| 2019 | $8,380 | $612,100 | $296,400 | $315,700 |
| 2018 | $8,183 | $586,200 | $281,100 | $305,100 |
| 2017 | $7,978 | $571,900 | $281,100 | $290,800 |
| 2016 | $6,801 | $489,600 | $216,400 | $273,200 |
| 2015 | $6,546 | $475,000 | $216,400 | $258,600 |
Source: Public Records
Map
Nearby Homes
- 3 Warren Dr
- 1 Mill Terrace
- 35 East St
- 20-B Wildmeadow Rd
- 34 Wildmeadow Rd
- 180 Rowley Bridge Rd
- 10 Oak St
- 47 Maple St Unit A
- 11 James Coffin Way Unit 11
- 207 Rowley Bridge Rd
- 36 Village Rd Unit 603
- 36 Village Rd Unit 506
- 40 Curtis Rd
- 38 Village Rd Unit 515
- 244 Rowley Bridge Rd
- 15 Rowell Ln Unit 15
- 17 Lavoie Ln
- 40 Village Rd Unit 1210
- 40 Village Rd Unit 1006
- 5 Wennerberg Rd
Your Personal Tour Guide
Ask me questions while you tour the home.