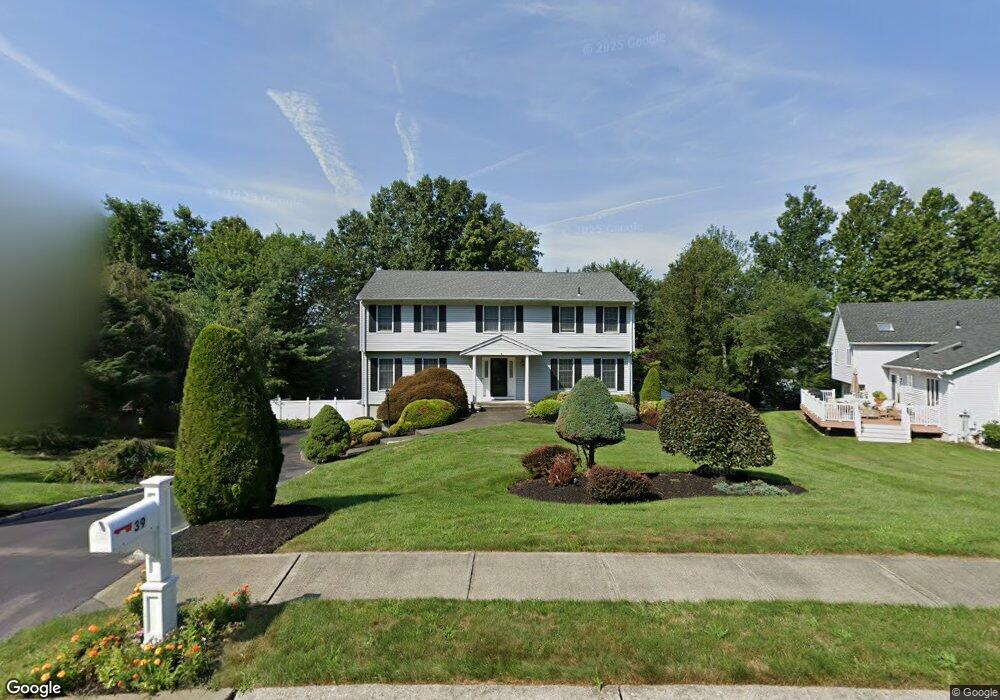
39 Peach St Nanuet, NY 10954
Estimated Value: $1,057,000 - $1,232,000
4
Beds
4
Baths
3,243
Sq Ft
$344/Sq Ft
Est. Value
About This Home
This home is located at 39 Peach St, Nanuet, NY 10954 and is currently estimated at $1,115,756, approximately $344 per square foot. 39 Peach St is a home located in Rockland County with nearby schools including George W Miller Elementary School, Highview Elementary School, and A Macarthur Barr Middle School.
Ownership History
Date
Name
Owned For
Owner Type
Purchase Details
Closed on
Apr 13, 2010
Sold by
Cahill James and Cahill Marie
Bought by
Wang Lixiang B and Wu Cherry H
Current Estimated Value
Home Financials for this Owner
Home Financials are based on the most recent Mortgage that was taken out on this home.
Original Mortgage
$589,200
Outstanding Balance
$392,233
Interest Rate
4.99%
Mortgage Type
New Conventional
Estimated Equity
$723,523
Create a Home Valuation Report for This Property
The Home Valuation Report is an in-depth analysis detailing your home's value as well as a comparison with similar homes in the area
Home Values in the Area
Average Home Value in this Area
Purchase History
| Date | Buyer | Sale Price | Title Company |
|---|---|---|---|
| Wang Lixiang B | $736,500 | None Available |
Source: Public Records
Mortgage History
| Date | Status | Borrower | Loan Amount |
|---|---|---|---|
| Open | Wang Lixiang B | $589,200 |
Source: Public Records
Tax History Compared to Growth
Tax History
| Year | Tax Paid | Tax Assessment Tax Assessment Total Assessment is a certain percentage of the fair market value that is determined by local assessors to be the total taxable value of land and additions on the property. | Land | Improvement |
|---|---|---|---|---|
| 2024 | $24,781 | $301,900 | $64,700 | $237,200 |
| 2023 | $24,781 | $301,900 | $64,700 | $237,200 |
| 2022 | $7,263 | $301,900 | $64,700 | $237,200 |
| 2021 | $22,467 | $301,900 | $64,700 | $237,200 |
| 2020 | $21,955 | $301,900 | $64,700 | $237,200 |
| 2019 | $6,804 | $301,900 | $64,700 | $237,200 |
| 2018 | $20,798 | $301,900 | $64,700 | $237,200 |
| 2017 | $20,571 | $301,900 | $64,700 | $237,200 |
| 2016 | $19,226 | $301,900 | $64,700 | $237,200 |
| 2015 | -- | $301,900 | $64,700 | $237,200 |
| 2014 | -- | $327,800 | $64,700 | $263,100 |
Source: Public Records
Map
Nearby Homes