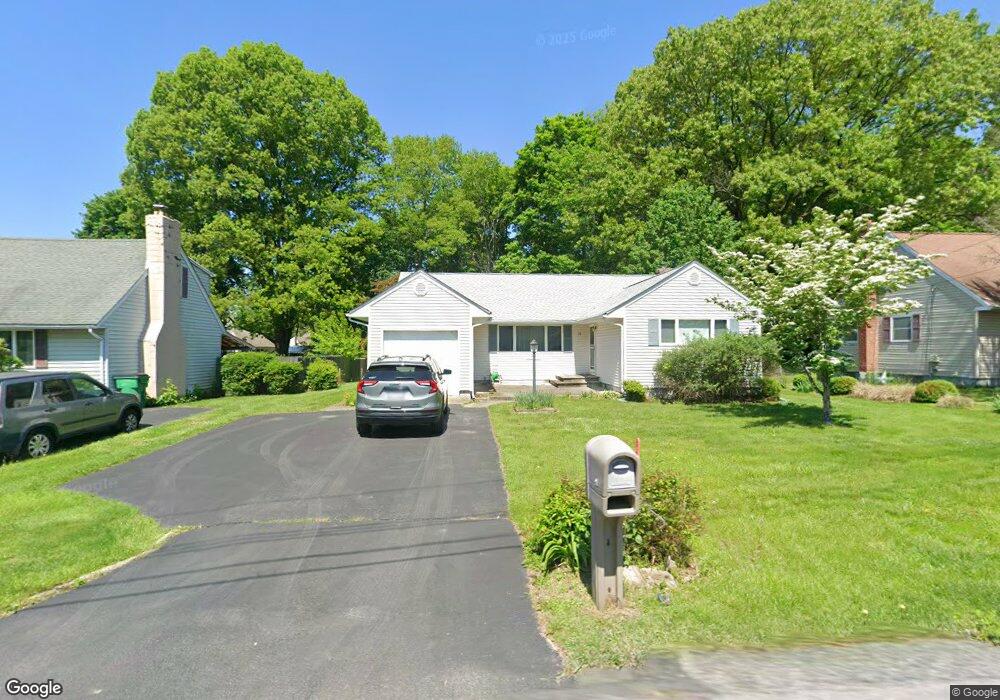
39 Phyllis Rd Wappingers Falls, NY 12590
Estimated Value: $404,000 - $435,000
3
Beds
2
Baths
1,352
Sq Ft
$309/Sq Ft
Est. Value
About This Home
This home is located at 39 Phyllis Rd, Wappingers Falls, NY 12590 and is currently estimated at $418,039, approximately $309 per square foot. 39 Phyllis Rd is a home located in Dutchess County with nearby schools including Sheafe Road Elementary School, Wappingers Junior High School, and Roy C. Ketcham Senior High School.
Ownership History
Date
Name
Owned For
Owner Type
Purchase Details
Closed on
Sep 16, 2019
Sold by
Diana H Degroat Irt
Bought by
Degroat Katherine A
Current Estimated Value
Home Financials for this Owner
Home Financials are based on the most recent Mortgage that was taken out on this home.
Original Mortgage
$125,000
Outstanding Balance
$96,406
Interest Rate
3.6%
Mortgage Type
New Conventional
Estimated Equity
$321,633
Purchase Details
Closed on
Jan 23, 2014
Sold by
Degroat William
Bought by
Degroat Diana
Create a Home Valuation Report for This Property
The Home Valuation Report is an in-depth analysis detailing your home's value as well as a comparison with similar homes in the area
Home Values in the Area
Average Home Value in this Area
Purchase History
| Date | Buyer | Sale Price | Title Company |
|---|---|---|---|
| Degroat Katherine A | -- | -- | |
| Degroat Diana | -- | -- |
Source: Public Records
Mortgage History
| Date | Status | Borrower | Loan Amount |
|---|---|---|---|
| Open | Degroat Katherine A | $125,000 |
Source: Public Records
Tax History
| Year | Tax Paid | Tax Assessment Tax Assessment Total Assessment is a certain percentage of the fair market value that is determined by local assessors to be the total taxable value of land and additions on the property. | Land | Improvement |
|---|---|---|---|---|
| 2024 | $7,068 | $313,500 | $66,300 | $247,200 |
| 2023 | $10,978 | $313,500 | $66,300 | $247,200 |
| 2019 | $5,335 | $219,000 | $60,200 | $158,800 |
Source: Public Records
Map
Nearby Homes
- 6 Honey Ln
- 47 Main St
- 4 N Farm Ln
- 20 W Academy St
- 10 Marlorville Rd
- 2574-2576 South Ave
- 2647 E Main St
- 2408 Route 9d
- 1 Dean Ave
- 3 Spring St
- 2738 W Main St
- 2748 W Main St
- 90 Paggi Terrace
- 0 Brown Ave
- 2 Merrywood Rd
- 20 S Gilmore Blvd
- 4 Cameli Dr
- 64 Wenliss Terrace
- 60 Wenliss Terrace
- 126 Old Hopewell Rd
Your Personal Tour Guide
Ask me questions while you tour the home.