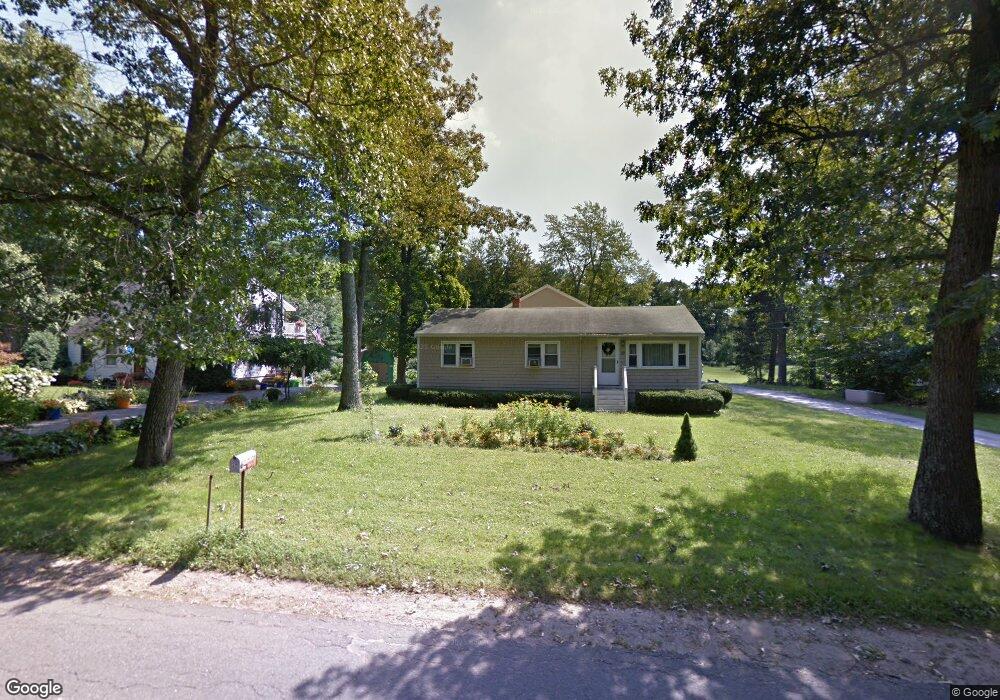
39 Pike St Salisbury, MA 01952
Estimated Value: $605,000 - $689,000
3
Beds
2
Baths
1,300
Sq Ft
$496/Sq Ft
Est. Value
About This Home
This home is located at 39 Pike St, Salisbury, MA 01952 and is currently estimated at $645,146, approximately $496 per square foot. 39 Pike St is a home located in Essex County with nearby schools including Triton Regional High School.
Ownership History
Date
Name
Owned For
Owner Type
Purchase Details
Closed on
Aug 30, 2024
Sold by
Nguyen Tan and Phan Loan
Bought by
Phan Loan
Current Estimated Value
Home Financials for this Owner
Home Financials are based on the most recent Mortgage that was taken out on this home.
Original Mortgage
$376,000
Outstanding Balance
$370,627
Interest Rate
6.78%
Mortgage Type
Stand Alone Refi Refinance Of Original Loan
Estimated Equity
$274,519
Purchase Details
Closed on
Oct 30, 2006
Sold by
Bunker Stephen P
Bought by
Nguyen Tan and Phan Loan
Home Financials for this Owner
Home Financials are based on the most recent Mortgage that was taken out on this home.
Original Mortgage
$268,000
Interest Rate
6.48%
Mortgage Type
Purchase Money Mortgage
Purchase Details
Closed on
Dec 30, 1996
Sold by
Wilmot Mildred Est and Snow
Bought by
Bunker Stephen P
Create a Home Valuation Report for This Property
The Home Valuation Report is an in-depth analysis detailing your home's value as well as a comparison with similar homes in the area
Home Values in the Area
Average Home Value in this Area
Purchase History
| Date | Buyer | Sale Price | Title Company |
|---|---|---|---|
| Phan Loan | -- | None Available | |
| Phan Loan | -- | None Available | |
| Phan Loan | -- | None Available | |
| Nguyen Tan | $335,000 | -- | |
| Bunker Stephen P | $99,000 | -- | |
| Nguyen Tan | $335,000 | -- | |
| Bunker Stephen P | $99,000 | -- |
Source: Public Records
Mortgage History
| Date | Status | Borrower | Loan Amount |
|---|---|---|---|
| Open | Phan Loan | $376,000 | |
| Closed | Phan Loan | $376,000 | |
| Previous Owner | Bunker Stephen P | $25,000 | |
| Previous Owner | Bunker Stephen P | $268,000 |
Source: Public Records
Tax History
| Year | Tax Paid | Tax Assessment Tax Assessment Total Assessment is a certain percentage of the fair market value that is determined by local assessors to be the total taxable value of land and additions on the property. | Land | Improvement |
|---|---|---|---|---|
| 2025 | $4,818 | $478,000 | $175,000 | $303,000 |
| 2024 | $4,709 | $450,600 | $175,000 | $275,600 |
| 2023 | $4,643 | $425,000 | $175,000 | $250,000 |
| 2022 | $4,375 | $413,400 | $157,600 | $255,800 |
| 2021 | $4,323 | $397,100 | $157,600 | $239,500 |
| 2020 | $4,194 | $366,000 | $157,600 | $208,400 |
| 2019 | $3,981 | $343,900 | $153,300 | $190,600 |
| 2018 | $3,864 | $330,600 | $146,700 | $183,900 |
| 2017 | $3,530 | $305,900 | $131,500 | $174,400 |
| 2016 | $3,585 | $307,200 | $127,100 | $180,100 |
| 2015 | $3,438 | $292,600 | $118,400 | $174,200 |
Source: Public Records
Map
Nearby Homes
Your Personal Tour Guide
Ask me questions while you tour the home.