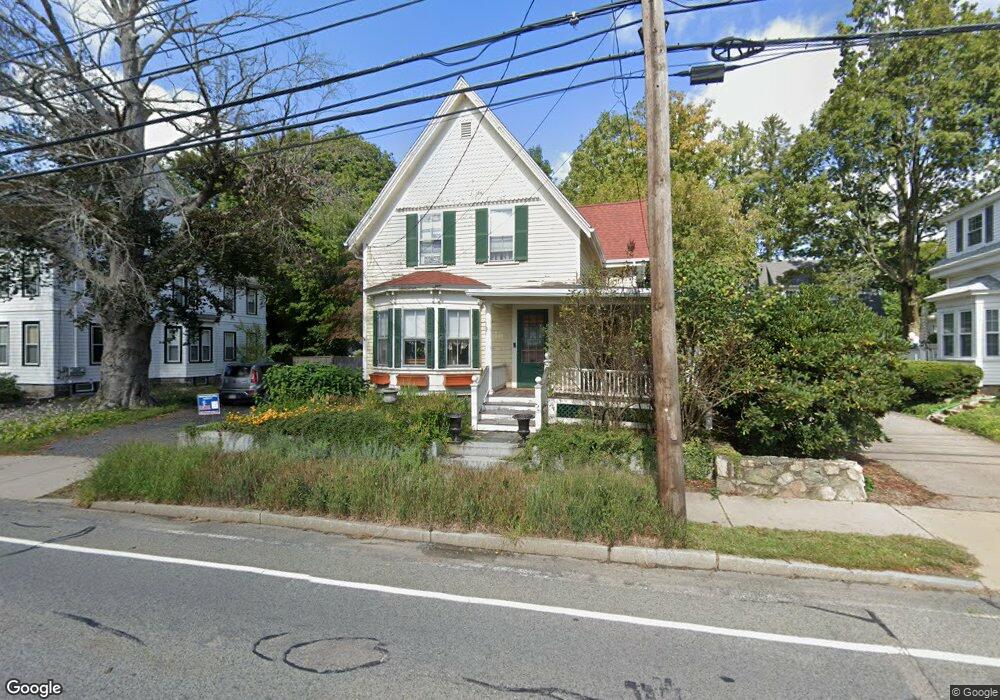
39 Pond St Natick, MA 01760
Estimated Value: $684,000 - $804,000
3
Beds
1
Bath
1,355
Sq Ft
$539/Sq Ft
Est. Value
About This Home
This home is located at 39 Pond St, Natick, MA 01760 and is currently estimated at $731,017, approximately $539 per square foot. 39 Pond St is a home located in Middlesex County with nearby schools including Natick High School, Johnson Elementary School, and J F Kennedy Middle School.
Ownership History
Date
Name
Owned For
Owner Type
Purchase Details
Closed on
Jul 29, 1999
Sold by
Gaziano John D and Gaziano Kris E
Bought by
Vician Kevin M and Vician Julie A
Current Estimated Value
Home Financials for this Owner
Home Financials are based on the most recent Mortgage that was taken out on this home.
Original Mortgage
$217,800
Interest Rate
7.61%
Mortgage Type
Purchase Money Mortgage
Purchase Details
Closed on
May 17, 1995
Sold by
Cullen Alexander F and Cullen Laura V
Bought by
Gaziano John D and Emens Kris
Purchase Details
Closed on
Aug 18, 1989
Sold by
Goheen Charles R
Bought by
Cullen Alexander F
Create a Home Valuation Report for This Property
The Home Valuation Report is an in-depth analysis detailing your home's value as well as a comparison with similar homes in the area
Home Values in the Area
Average Home Value in this Area
Purchase History
| Date | Buyer | Sale Price | Title Company |
|---|---|---|---|
| Vician Kevin M | $242,000 | -- | |
| Gaziano John D | $185,500 | -- | |
| Cullen Alexander F | $178,500 | -- |
Source: Public Records
Mortgage History
| Date | Status | Borrower | Loan Amount |
|---|---|---|---|
| Open | Cullen Alexander F | $204,638 | |
| Closed | Cullen Alexander F | $217,800 | |
| Previous Owner | Cullen Alexander F | $145,300 |
Source: Public Records
Tax History
| Year | Tax Paid | Tax Assessment Tax Assessment Total Assessment is a certain percentage of the fair market value that is determined by local assessors to be the total taxable value of land and additions on the property. | Land | Improvement |
|---|---|---|---|---|
| 2025 | $5,832 | $487,600 | $387,000 | $100,600 |
| 2024 | $5,636 | $459,700 | $365,500 | $94,200 |
| 2023 | $5,460 | $432,000 | $344,000 | $88,000 |
| 2022 | $5,260 | $394,300 | $313,900 | $80,400 |
| 2021 | $5,263 | $386,700 | $296,700 | $90,000 |
| 2020 | $0 | $375,800 | $270,900 | $104,900 |
| 2019 | $0 | $375,800 | $270,900 | $104,900 |
| 2018 | $4,391 | $336,500 | $258,000 | $78,500 |
| 2017 | $0 | $334,900 | $227,900 | $107,000 |
| 2016 | $4,337 | $319,600 | $213,600 | $106,000 |
| 2015 | $4,302 | $311,300 | $213,600 | $97,700 |
Source: Public Records
Map
Nearby Homes
- 63 Pond St
- 49 Summer St
- 58 W Central St
- 8 Floral Avenue Extension
- 12 Floral Ave
- 8 Floral Ave Unit 8
- 6 Floral Avenue Extension
- 6A Lincoln St Unit 6A
- 4B Lincoln St Unit 4B
- 9 Bellevue Rd
- 5 Wilson St Unit 5A
- 3A Wilson St Unit 3A
- 3 Wilson St Unit 3B
- 25 Forest Ave
- 11 Avon St
- 89 W Central St
- 16 Harvard St
- 20 Florence St Unit B
- 67 E Central St & 5 Union St
- 17 Florence St
Your Personal Tour Guide
Ask me questions while you tour the home.