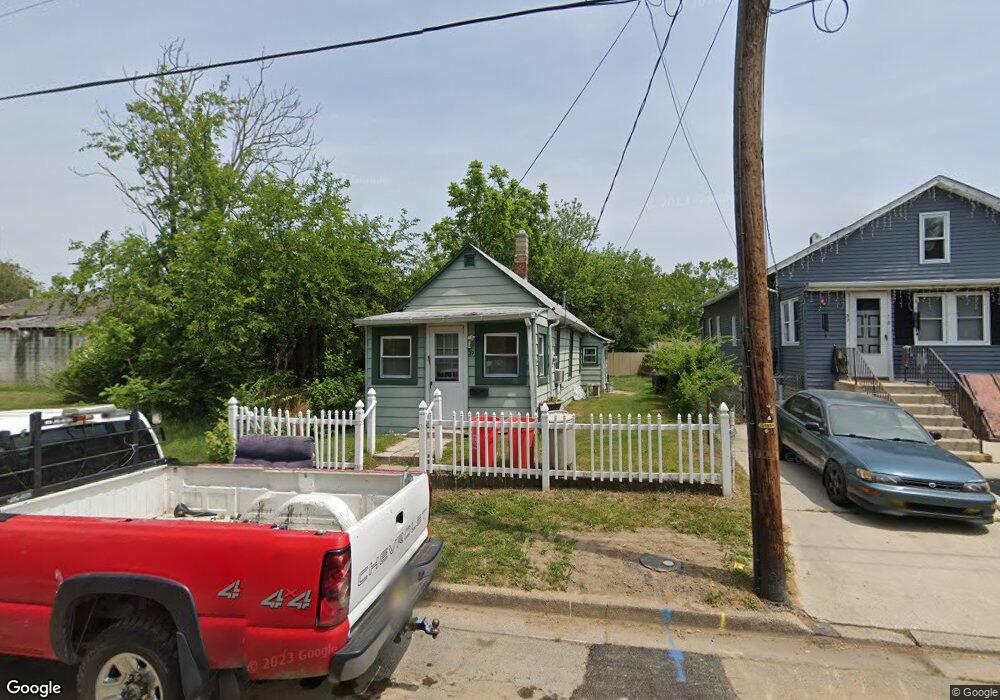
39 Poplar St Penns Grove, NJ 08069
Estimated Value: $94,751 - $138,000
--
Bed
--
Bath
792
Sq Ft
$139/Sq Ft
Est. Value
About This Home
This home is located at 39 Poplar St, Penns Grove, NJ 08069 and is currently estimated at $110,188, approximately $139 per square foot. 39 Poplar St is a home located in Salem County with nearby schools including Lafayette-Pershing Elementary School, Field Street Elementary School, and Paul W. Carleton Elementary School.
Ownership History
Date
Name
Owned For
Owner Type
Purchase Details
Closed on
Nov 7, 2022
Sold by
Booth James
Bought by
Delgado Rogelio and Sanchez Leslie M
Current Estimated Value
Purchase Details
Closed on
Apr 12, 2012
Sold by
Hogate David and Hogate Betty
Bought by
Booth James and Raffa Arlene
Purchase Details
Closed on
Apr 5, 2004
Sold by
Hewitt Anita
Bought by
Hogate David and Hogate Betty
Purchase Details
Closed on
Nov 21, 2003
Sold by
Hogate Belford S
Bought by
Hewitt Anita
Purchase Details
Closed on
Apr 12, 2000
Sold by
Hogate Belford S and Hogate Mildred W
Bought by
Hogate Belford S
Create a Home Valuation Report for This Property
The Home Valuation Report is an in-depth analysis detailing your home's value as well as a comparison with similar homes in the area
Home Values in the Area
Average Home Value in this Area
Purchase History
| Date | Buyer | Sale Price | Title Company |
|---|---|---|---|
| Delgado Rogelio | $25,000 | -- | |
| Delgado Rogelio | $25,000 | None Listed On Document | |
| Booth James | $5,000 | -- | |
| Hogate David | -- | -- | |
| Hewitt Anita | -- | -- | |
| Hogate Belford S | -- | -- |
Source: Public Records
Tax History Compared to Growth
Tax History
| Year | Tax Paid | Tax Assessment Tax Assessment Total Assessment is a certain percentage of the fair market value that is determined by local assessors to be the total taxable value of land and additions on the property. | Land | Improvement |
|---|---|---|---|---|
| 2025 | $2,163 | $39,000 | $9,200 | $29,800 |
| 2024 | $2,090 | $39,000 | $9,200 | $29,800 |
| 2023 | $2,090 | $39,000 | $9,200 | $29,800 |
| 2022 | $2,015 | $39,000 | $9,200 | $29,800 |
| 2021 | $1,928 | $39,000 | $9,200 | $29,800 |
| 2020 | $1,954 | $39,000 | $9,200 | $29,800 |
| 2019 | $1,962 | $39,000 | $9,200 | $29,800 |
| 2018 | $2,158 | $53,500 | $17,700 | $35,800 |
| 2017 | $2,166 | $53,500 | $17,700 | $35,800 |
| 2016 | $2,084 | $53,500 | $17,700 | $35,800 |
| 2015 | $1,996 | $53,500 | $17,700 | $35,800 |
| 2014 | -- | $53,500 | $17,700 | $35,800 |
Source: Public Records
Map
Nearby Homes
- 59 61 Broad St
- 18 Pearl St
- 113 N Broad St
- 71 Poplar St
- 54 W Pitman St
- 87 W Pitman St
- 27 E Line St
- 6 W Griffith St
- 28 4th Ave
- 31 Elvin Ave
- 35 Franklin St
- 78 W Harmony St
- 89 Delaware Ave
- 48 Penn St
- 102 Delaware Ave Unit FRONT
- 3 Naylor Ave
- 81 7th Ave
- 22 Delaware Ave
- 136 Penns Grove Auburn Rd
- 88 Railroad Ave