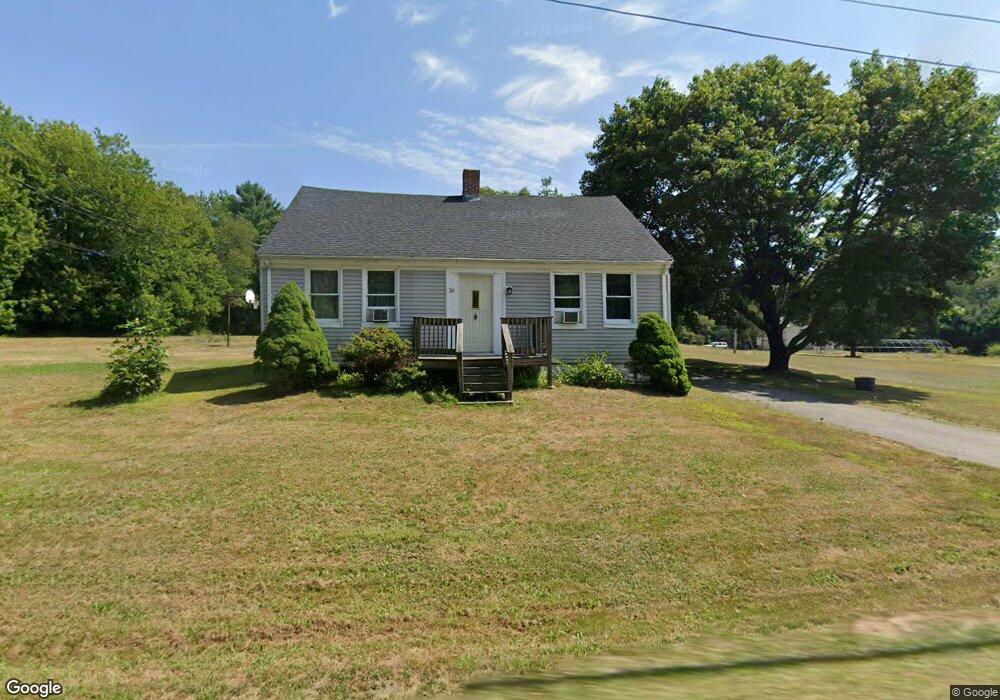
39 Porter St Berkley, MA 02779
Berkley Bridge/Lower Berkley NeighborhoodEstimated Value: $218,979
2
Beds
1
Bath
1,512
Sq Ft
$145/Sq Ft
Est. Value
About This Home
This home is located at 39 Porter St, Berkley, MA 02779 and is currently priced at $218,979, approximately $144 per square foot. 39 Porter St is a home located in Bristol County with nearby schools including Berkley Community School and Our Lady of Lourdes School.
Ownership History
Date
Name
Owned For
Owner Type
Purchase Details
Closed on
May 31, 2007
Sold by
Lopez Sheila M
Bought by
Lopez Herman and Lopez Sheila M
Current Estimated Value
Home Financials for this Owner
Home Financials are based on the most recent Mortgage that was taken out on this home.
Original Mortgage
$54,000
Outstanding Balance
$33,132
Interest Rate
6.24%
Mortgage Type
Commercial
Create a Home Valuation Report for This Property
The Home Valuation Report is an in-depth analysis detailing your home's value as well as a comparison with similar homes in the area
Home Values in the Area
Average Home Value in this Area
Purchase History
| Date | Buyer | Sale Price | Title Company |
|---|---|---|---|
| Lopez Herman | -- | -- |
Source: Public Records
Mortgage History
| Date | Status | Borrower | Loan Amount |
|---|---|---|---|
| Open | Lopez Herman | $54,000 |
Source: Public Records
Tax History Compared to Growth
Tax History
| Year | Tax Paid | Tax Assessment Tax Assessment Total Assessment is a certain percentage of the fair market value that is determined by local assessors to be the total taxable value of land and additions on the property. | Land | Improvement |
|---|---|---|---|---|
| 2025 | $43 | $359,500 | $145,000 | $214,500 |
| 2024 | $3,752 | $301,400 | $124,900 | $176,500 |
| 2023 | $3,735 | $282,500 | $124,900 | $157,600 |
| 2022 | $3,585 | $260,700 | $108,600 | $152,100 |
| 2021 | $21,705 | $246,100 | $103,400 | $142,700 |
| 2020 | $3,368 | $231,800 | $91,500 | $140,300 |
| 2019 | $21,276 | $226,700 | $91,500 | $135,200 |
| 2018 | $3,063 | $218,500 | $88,000 | $130,500 |
| 2017 | $19,425 | $217,000 | $98,600 | $118,400 |
| 2016 | $3,061 | $206,300 | $98,600 | $107,700 |
| 2015 | $3,295 | $236,900 | $127,700 | $109,200 |
| 2014 | $3,080 | $240,400 | $127,700 | $112,700 |
Source: Public Records
Map
Nearby Homes