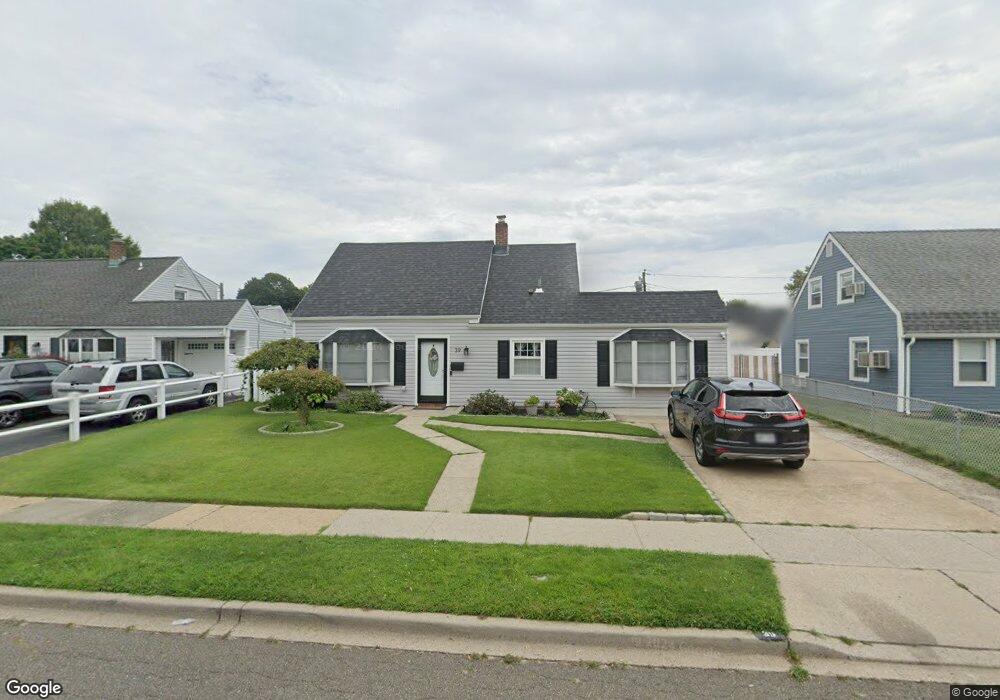
39 Ranch Ln Levittown, NY 11756
Estimated Value: $614,892 - $705,000
Studio
1
Bath
1,442
Sq Ft
$458/Sq Ft
Est. Value
About This Home
This home is located at 39 Ranch Ln, Levittown, NY 11756 and is currently estimated at $659,946, approximately $457 per square foot. 39 Ranch Ln is a home located in Nassau County with nearby schools including Abbey Lane Elementary School, Wisdom Lane Middle School, and Division Avenue Senior High School.
Ownership History
Date
Name
Owned For
Owner Type
Purchase Details
Closed on
Mar 6, 2007
Sold by
Saraniero Alexander
Bought by
Sarmiento Michael
Current Estimated Value
Purchase Details
Closed on
Apr 28, 1995
Sold by
Kollmann Francis and Kollmann Helen
Bought by
Saraniero Alexander and Saraniero Norma
Home Financials for this Owner
Home Financials are based on the most recent Mortgage that was taken out on this home.
Original Mortgage
$115,600
Interest Rate
8.31%
Create a Home Valuation Report for This Property
The Home Valuation Report is an in-depth analysis detailing your home's value as well as a comparison with similar homes in the area
Home Values in the Area
Average Home Value in this Area
Purchase History
| Date | Buyer | Sale Price | Title Company |
|---|---|---|---|
| Sarmiento Michael | $420,000 | -- | |
| Saraniero Alexander | $144,500 | -- |
Source: Public Records
Mortgage History
| Date | Status | Borrower | Loan Amount |
|---|---|---|---|
| Previous Owner | Saraniero Alexander | $115,600 |
Source: Public Records
Tax History
| Year | Tax Paid | Tax Assessment Tax Assessment Total Assessment is a certain percentage of the fair market value that is determined by local assessors to be the total taxable value of land and additions on the property. | Land | Improvement |
|---|---|---|---|---|
| 2025 | $11,994 | $401 | $207 | $194 |
| 2024 | $3,159 | $389 | $201 | $188 |
Source: Public Records
Map
Nearby Homes
Your Personal Tour Guide
Ask me questions while you tour the home.