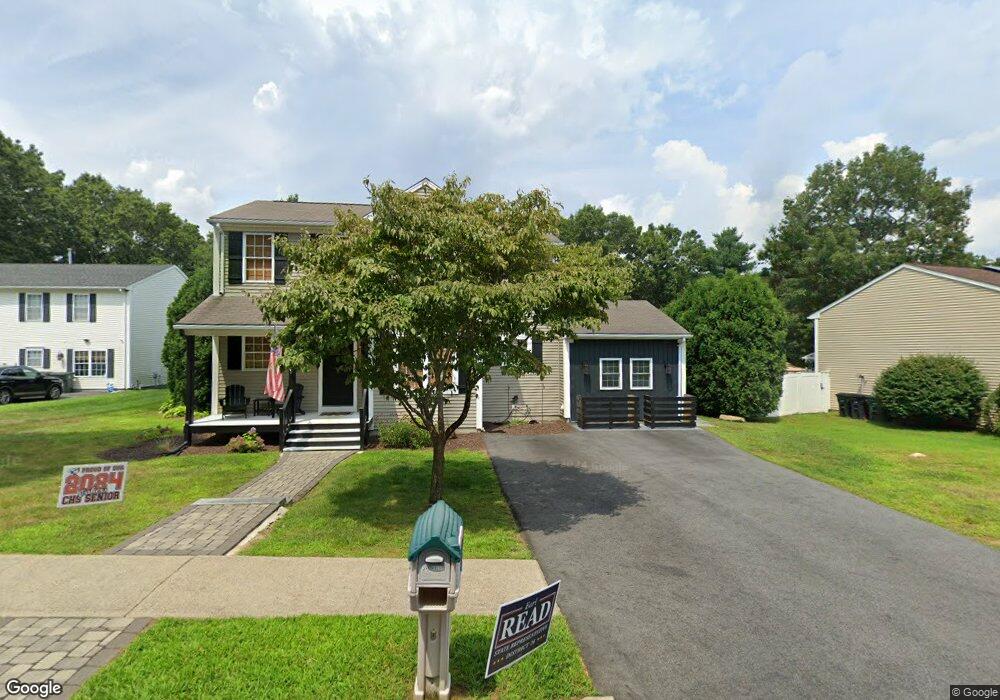
39 Remington Farm Dr Coventry, RI 02816
Estimated Value: $533,835 - $577,000
3
Beds
3
Baths
1,764
Sq Ft
$320/Sq Ft
Est. Value
About This Home
This home is located at 39 Remington Farm Dr, Coventry, RI 02816 and is currently estimated at $563,959, approximately $319 per square foot. 39 Remington Farm Dr is a home located in Kent County with nearby schools including Alan Shawn Feinstein Ms Of Cov, Coventry High School, and Father John V. Doyle School.
Ownership History
Date
Name
Owned For
Owner Type
Purchase Details
Closed on
Oct 20, 2015
Sold by
Kelly John W and Kelly Sandralee R
Bought by
Kelly John W
Current Estimated Value
Purchase Details
Closed on
Jul 31, 2015
Sold by
Kelly John W and Kelly Sandralee R
Bought by
Kelly John W
Purchase Details
Closed on
Jun 2, 1999
Sold by
Jgp Builders Inc
Bought by
Kelly John W and Kelly Sandralee R
Create a Home Valuation Report for This Property
The Home Valuation Report is an in-depth analysis detailing your home's value as well as a comparison with similar homes in the area
Home Values in the Area
Average Home Value in this Area
Purchase History
| Date | Buyer | Sale Price | Title Company |
|---|---|---|---|
| Kelly John W | -- | -- | |
| Kelly John W | -- | -- | |
| Kelly John W | $150,500 | -- |
Source: Public Records
Mortgage History
| Date | Status | Borrower | Loan Amount |
|---|---|---|---|
| Previous Owner | Kelly John W | $233,100 | |
| Previous Owner | Kelly John W | $256,000 |
Source: Public Records
Tax History Compared to Growth
Tax History
| Year | Tax Paid | Tax Assessment Tax Assessment Total Assessment is a certain percentage of the fair market value that is determined by local assessors to be the total taxable value of land and additions on the property. | Land | Improvement |
|---|---|---|---|---|
| 2024 | $6,401 | $404,100 | $110,900 | $293,200 |
| 2023 | $6,195 | $404,100 | $110,900 | $293,200 |
| 2022 | $6,208 | $317,200 | $108,900 | $208,300 |
| 2021 | $6,154 | $317,200 | $108,900 | $208,300 |
| 2020 | $7,003 | $314,900 | $108,900 | $206,000 |
| 2019 | $6,192 | $278,400 | $93,600 | $184,800 |
| 2018 | $6,016 | $278,400 | $93,600 | $184,800 |
| 2017 | $5,841 | $278,400 | $93,600 | $184,800 |
| 2016 | $5,659 | $264,300 | $87,000 | $177,300 |
| 2015 | $5,505 | $264,300 | $87,000 | $177,300 |
| 2014 | $5,390 | $264,300 | $87,000 | $177,300 |
| 2013 | $4,762 | $255,200 | $94,100 | $161,100 |
Source: Public Records
Map
Nearby Homes
- 52 Ginger Trail
- 22 Glenwood Dr
- 293 Station St
- 51 Knotty Oak Shore
- 20 Maplewood Dr
- 1 White Rock Rd
- 14 Sheri Dr
- 45 Niblick Cir
- 166 Gervais St
- 9 Regent St Unit 11
- 0 Chase Rd Unit 1365354
- 198 Colvintown Rd
- 19 Black Walnut Dr
- 0 Chase Lot 11 Rd Unit 1391514
- 30 Hope Furnace Rd
- 16 Hope Furnace Rd
- 152 Fairway Dr
- 2 Hawthorne Rd
- 2 Country View Dr
- 14 Dawn Ln
- 37 Remington Farm Dr
- 41 Remington Farm Dr
- 35 Remington Farm Dr
- 43 Remington Farm Dr
- 22 Moss Ln
- 42 Remington Farm Dr
- 33 Remington Farm Dr
- 23 Moss Ln
- 45 Remington Farm Dr
- 44 Remington Farm Dr
- 34 Remington Farm Dr
- 20 Moss Ln
- 46 Remington Farm Dr
- 47 Remington Farm Dr
- 21 Moss Ln
- 32 Remington Farm Dr
- 48 Remington Farm Dr
- 18 Moss Ln
- 29 Remington Farm Dr
- 30 Remington Farm Dr