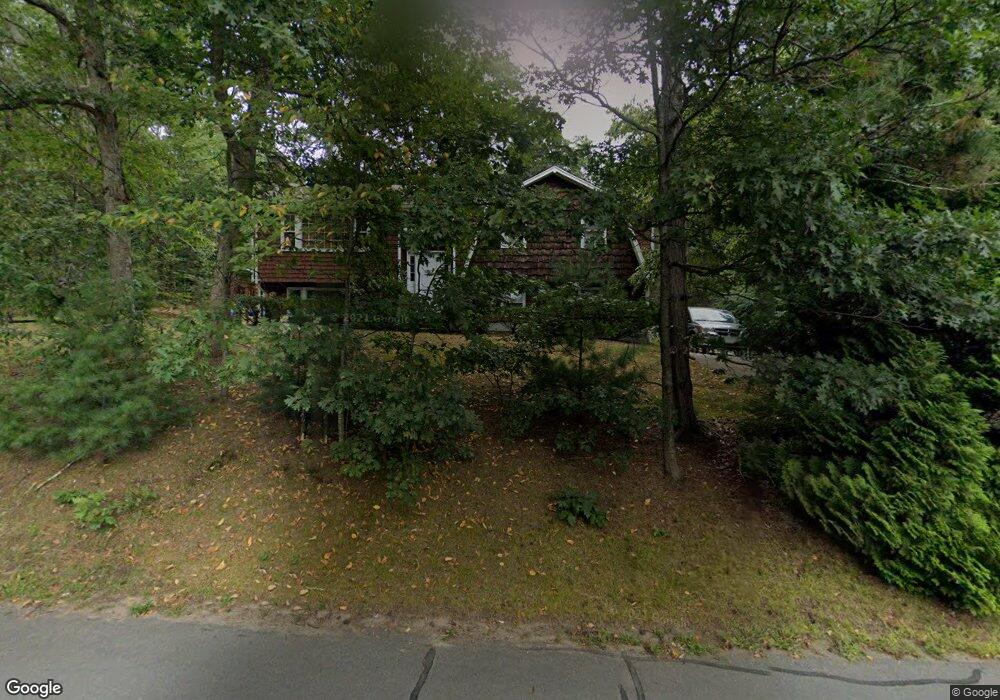
39 Ridge Rd Foxboro, MA 02035
Estimated Value: $617,743 - $712,000
5
Beds
2
Baths
1,184
Sq Ft
$555/Sq Ft
Est. Value
About This Home
This home is located at 39 Ridge Rd, Foxboro, MA 02035 and is currently estimated at $656,936, approximately $554 per square foot. 39 Ridge Rd is a home located in Norfolk County with nearby schools including Foxborough High School, Foxborough Regional Charter School, and The Sage School.
Ownership History
Date
Name
Owned For
Owner Type
Purchase Details
Closed on
Feb 26, 2025
Sold by
Henderson Robert B and Henderson Deborah L
Bought by
Henderson Ft and Henderson
Current Estimated Value
Purchase Details
Closed on
Dec 2, 1985
Bought by
Henderson Robert B and Henderson Deborah
Create a Home Valuation Report for This Property
The Home Valuation Report is an in-depth analysis detailing your home's value as well as a comparison with similar homes in the area
Home Values in the Area
Average Home Value in this Area
Purchase History
| Date | Buyer | Sale Price | Title Company |
|---|---|---|---|
| Henderson Ft | -- | None Available | |
| Henderson Ft | -- | None Available | |
| Henderson Robert B | -- | -- |
Source: Public Records
Mortgage History
| Date | Status | Borrower | Loan Amount |
|---|---|---|---|
| Previous Owner | Henderson Robert B | $61,500 | |
| Previous Owner | Henderson Robert B | $40,000 |
Source: Public Records
Tax History
| Year | Tax Paid | Tax Assessment Tax Assessment Total Assessment is a certain percentage of the fair market value that is determined by local assessors to be the total taxable value of land and additions on the property. | Land | Improvement |
|---|---|---|---|---|
| 2025 | $7,127 | $539,100 | $247,500 | $291,600 |
| 2024 | $6,897 | $510,500 | $252,000 | $258,500 |
| 2023 | $6,700 | $471,500 | $239,900 | $231,600 |
| 2022 | $6,061 | $417,400 | $201,100 | $216,300 |
| 2021 | $5,660 | $384,000 | $186,200 | $197,800 |
| 2020 | $5,285 | $362,700 | $186,200 | $176,500 |
| 2019 | $5,157 | $350,800 | $177,400 | $173,400 |
| 2018 | $5,022 | $344,700 | $177,400 | $167,300 |
| 2017 | $4,896 | $325,500 | $165,800 | $159,700 |
| 2016 | $5,015 | $338,400 | $167,200 | $171,200 |
| 2015 | $4,795 | $315,700 | $141,400 | $174,300 |
| 2014 | $4,593 | $306,400 | $132,100 | $174,300 |
Source: Public Records
Map
Nearby Homes
- 73 Ridge Rd
- 147 Chestnut St Unit A
- 147 Chestnut St Unit B
- 2 Thompson Rd
- 165 Chestnut St Unit 2
- 1 Maura Elizabeth Ln
- 26 Fuller Rd Unit 6
- 14 Baker St
- 96 Main St Unit E4
- 54 Main St Unit A
- 13 Summerville Rd Unit 13
- 67 Carpenter St
- 668 S Main St
- 157 Central St
- 180 Old Post Rd Unit 202
- 180 Old Post Rd Unit 206
- 180 Old Post Rd Unit 308
- 180 Old Post Rd Unit 201
- 180 Old Post Rd Unit 405
- 180 Old Post Rd Unit 207
Your Personal Tour Guide
Ask me questions while you tour the home.