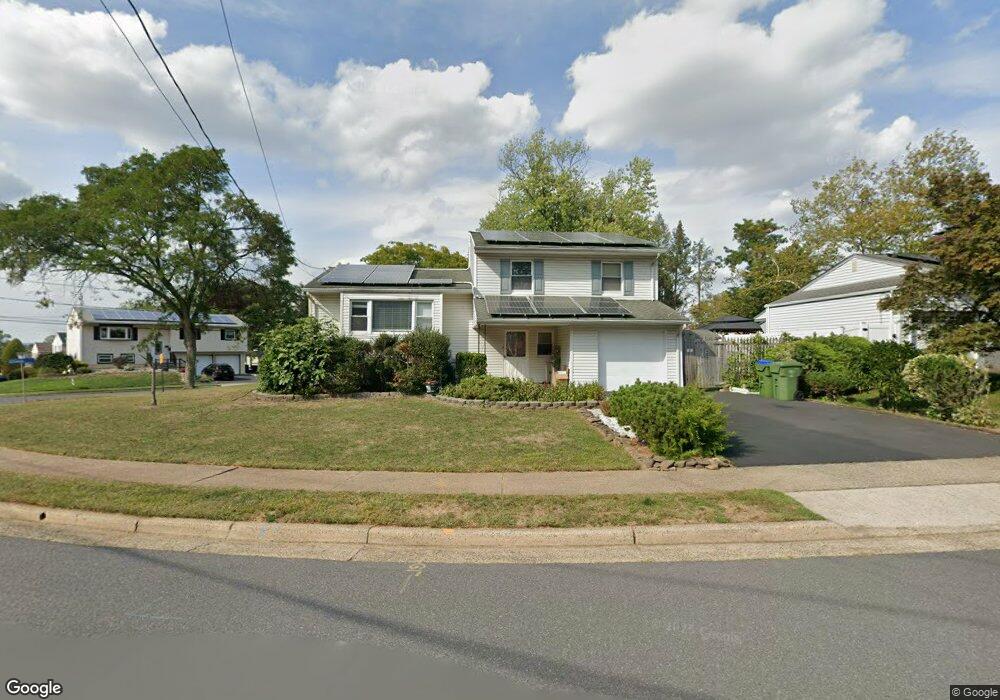
39 Rieder Rd Edison, NJ 08817
Estimated Value: $622,973 - $740,000
--
Bed
--
Bath
1,472
Sq Ft
$459/Sq Ft
Est. Value
About This Home
This home is located at 39 Rieder Rd, Edison, NJ 08817 and is currently estimated at $675,243, approximately $458 per square foot. 39 Rieder Rd is a home located in Middlesex County with nearby schools including Woodbrook Elementary School, Woodrow Wilson Middle School, and J.P. Stevens High School.
Ownership History
Date
Name
Owned For
Owner Type
Purchase Details
Closed on
May 28, 1996
Sold by
Marx Fred
Bought by
Yang Tzuu Tair and Yang Yu Mi
Current Estimated Value
Home Financials for this Owner
Home Financials are based on the most recent Mortgage that was taken out on this home.
Original Mortgage
$110,000
Outstanding Balance
$6,958
Interest Rate
7.89%
Estimated Equity
$668,285
Purchase Details
Closed on
Mar 8, 1995
Sold by
Winfough Thomas
Bought by
Marx Fred
Home Financials for this Owner
Home Financials are based on the most recent Mortgage that was taken out on this home.
Original Mortgage
$166,000
Interest Rate
8.78%
Create a Home Valuation Report for This Property
The Home Valuation Report is an in-depth analysis detailing your home's value as well as a comparison with similar homes in the area
Home Values in the Area
Average Home Value in this Area
Purchase History
| Date | Buyer | Sale Price | Title Company |
|---|---|---|---|
| Yang Tzuu Tair | $180,000 | -- | |
| Marx Fred | $175,000 | -- |
Source: Public Records
Mortgage History
| Date | Status | Borrower | Loan Amount |
|---|---|---|---|
| Open | Yang Tzuu Tair | $110,000 | |
| Previous Owner | Marx Fred | $166,000 |
Source: Public Records
Tax History Compared to Growth
Tax History
| Year | Tax Paid | Tax Assessment Tax Assessment Total Assessment is a certain percentage of the fair market value that is determined by local assessors to be the total taxable value of land and additions on the property. | Land | Improvement |
|---|---|---|---|---|
| 2025 | $10,061 | $169,000 | $94,400 | $74,600 |
| 2024 | $10,006 | $169,000 | $94,400 | $74,600 |
| 2023 | $10,006 | $169,000 | $94,400 | $74,600 |
| 2022 | $10,010 | $169,000 | $94,400 | $74,600 |
| 2021 | $9,339 | $169,000 | $94,400 | $74,600 |
| 2020 | $9,885 | $169,000 | $94,400 | $74,600 |
| 2019 | $8,692 | $169,000 | $94,400 | $74,600 |
| 2018 | $8,847 | $169,000 | $94,400 | $74,600 |
| 2017 | $9,081 | $169,000 | $94,400 | $74,600 |
| 2016 | $8,916 | $169,000 | $94,400 | $74,600 |
| 2015 | $8,575 | $169,000 | $94,400 | $74,600 |
| 2014 | $8,325 | $169,000 | $94,400 | $74,600 |
Source: Public Records
Map
Nearby Homes