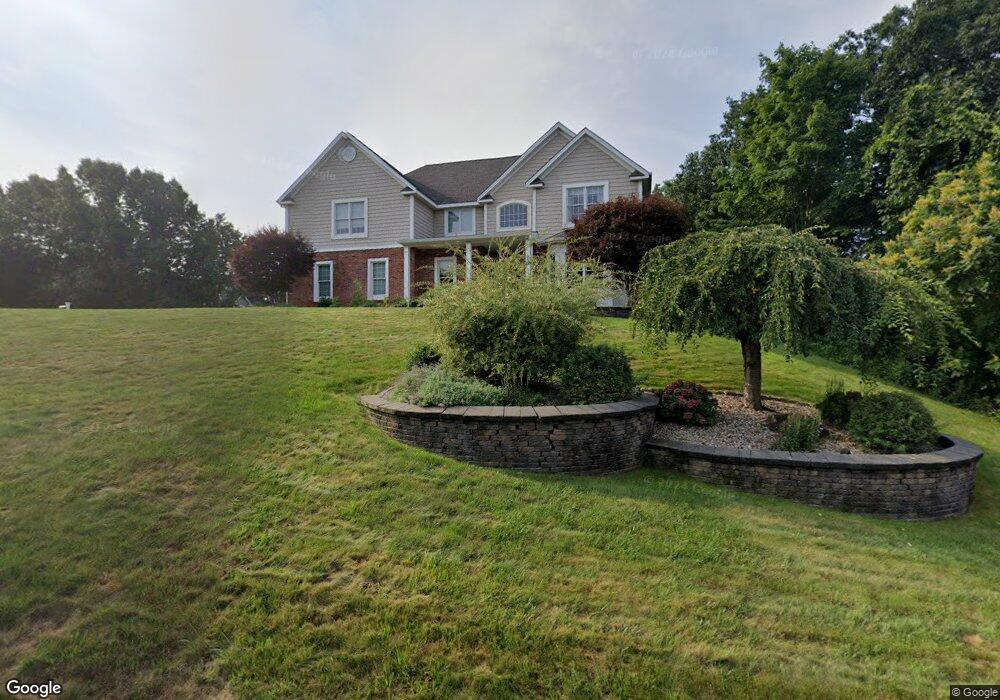
39 Rockledge Dr Newington, CT 06111
Estimated Value: $647,000 - $972,000
3
Beds
3
Baths
3,412
Sq Ft
$233/Sq Ft
Est. Value
About This Home
This home is located at 39 Rockledge Dr, Newington, CT 06111 and is currently estimated at $795,091, approximately $233 per square foot. 39 Rockledge Dr is a home located in Hartford County with nearby schools including Ruth Chaffee School, John Wallace Middle School, and Newington High School.
Ownership History
Date
Name
Owned For
Owner Type
Purchase Details
Closed on
Aug 29, 1995
Sold by
Seth Co Inc
Bought by
Dicenso Stephen and Dicenso Georgeanne E
Current Estimated Value
Home Financials for this Owner
Home Financials are based on the most recent Mortgage that was taken out on this home.
Original Mortgage
$253,000
Interest Rate
7.32%
Mortgage Type
Unknown
Purchase Details
Closed on
Jul 17, 1995
Sold by
Mclaughlin Patricia
Bought by
Salinsky Kathy and Salinsky William
Home Financials for this Owner
Home Financials are based on the most recent Mortgage that was taken out on this home.
Original Mortgage
$253,000
Interest Rate
7.32%
Mortgage Type
Unknown
Purchase Details
Closed on
Mar 31, 1995
Sold by
Seraphin Robert A
Bought by
Seraphin Eugene W
Purchase Details
Closed on
Jan 27, 1995
Sold by
Daly Teresa W and Daly Bergin J
Bought by
Bukhari Syedah D and Kazme Syed M
Home Financials for this Owner
Home Financials are based on the most recent Mortgage that was taken out on this home.
Original Mortgage
$97,000
Interest Rate
9.24%
Mortgage Type
Unknown
Create a Home Valuation Report for This Property
The Home Valuation Report is an in-depth analysis detailing your home's value as well as a comparison with similar homes in the area
Home Values in the Area
Average Home Value in this Area
Purchase History
| Date | Buyer | Sale Price | Title Company |
|---|---|---|---|
| Dicenso Stephen | $298,000 | -- | |
| Salinsky Kathy | $168,000 | -- | |
| Seraphin Eugene W | $46,000 | -- | |
| Bukhari Syedah D | $100,000 | -- |
Source: Public Records
Mortgage History
| Date | Status | Borrower | Loan Amount |
|---|---|---|---|
| Open | Bukhari Syedah D | $299,900 | |
| Closed | Bukhari Syedah D | $253,000 | |
| Closed | Bukhari Syedah D | $151,200 | |
| Previous Owner | Bukhari Syedah D | $97,000 |
Source: Public Records
Tax History Compared to Growth
Tax History
| Year | Tax Paid | Tax Assessment Tax Assessment Total Assessment is a certain percentage of the fair market value that is determined by local assessors to be the total taxable value of land and additions on the property. | Land | Improvement |
|---|---|---|---|---|
| 2025 | $12,824 | $320,750 | $82,680 | $238,070 |
| 2024 | $12,724 | $320,750 | $82,680 | $238,070 |
| 2023 | $12,304 | $320,750 | $82,680 | $238,070 |
| 2022 | $12,346 | $320,750 | $82,680 | $238,070 |
| 2021 | $12,448 | $320,750 | $82,680 | $238,070 |
| 2020 | $13,055 | $332,370 | $82,690 | $249,680 |
| 2019 | $13,112 | $332,370 | $82,690 | $249,680 |
| 2018 | $12,796 | $332,370 | $82,690 | $249,680 |
| 2017 | $12,161 | $332,370 | $82,690 | $249,680 |
| 2016 | $11,882 | $332,370 | $82,690 | $249,680 |
| 2014 | $12,159 | $349,710 | $66,260 | $283,450 |
Source: Public Records
Map
Nearby Homes
- 14 Kowal Ct
- 22 Apple Hill
- 9 Coachmen Ln
- 19 Sunnybrook Dr
- 53 Salem Dr
- 2990 Berlin Turnpike
- 2950 Berlin Turnpike
- 634 New Britain Ave
- 40 Country Side Dr
- 221 Westmeadow Rd
- 660/674 Church Rear St
- 18 Stone Hill Dr
- 43 Steeplechase Dr Unit 43
- 120 Fox Run Ct
- 124 Speno Ridge
- 163 Speno Ridge
- 38 Robin Brook Dr
- 35 Woodsedge Dr Unit 4C
- 15 Woodsedge Dr Unit 6C
- 15 Woodsedge Dr Unit 4B
- 52 Rockledge Dr
- 53 Rockledge Dr
- 60 Shady Hill Ln
- 63 Rockledge Dr
- 59 Shady Hill Ln
- 62 Rockledge Dr
- 72 Rockledge Dr
- 53 Shady Hill Ln
- 23 Rockledge Dr
- 22 Rockledge Dr
- 75 Rockledge Dr
- 43 Apple Hill
- 37 Apple Hill
- 37 Apple Hill Unit 56
- 41 Apple Hill
- 39 Apple Hill
- 39 Apple Hill Unit 39
- 45 Apple Hill
- 45 Apple Hill Unit 45
- 54 Shady Hill Ln