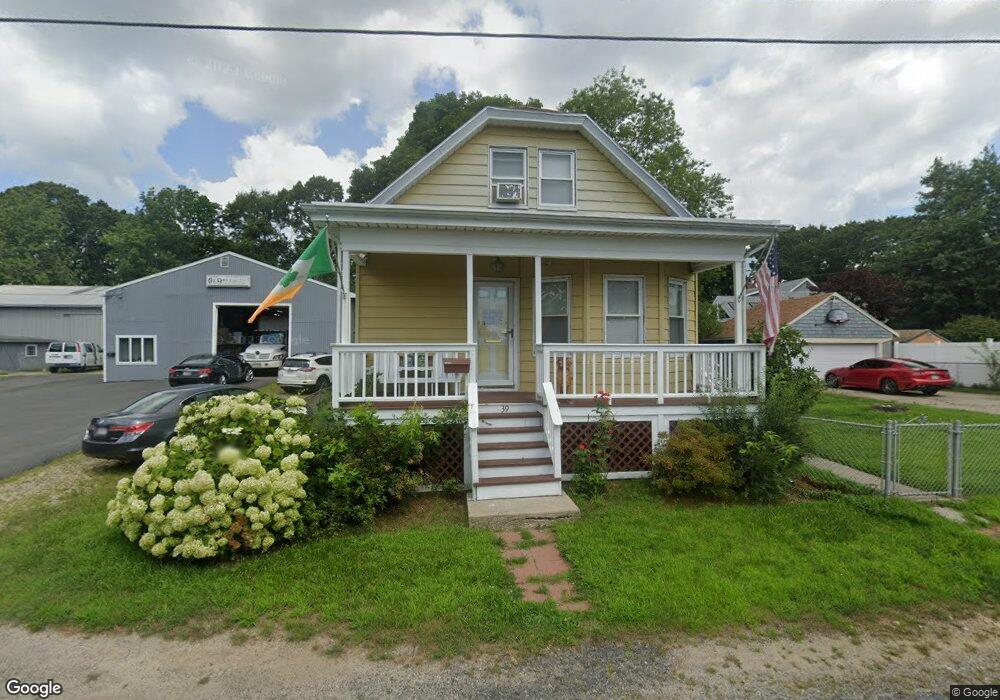
39 Roosevelt St Acushnet, MA 02743
Estimated Value: $329,000 - $446,000
Studio
1
Bath
1,198
Sq Ft
$324/Sq Ft
Est. Value
About This Home
This home is located at 39 Roosevelt St, Acushnet, MA 02743 and is currently estimated at $388,368, approximately $324 per square foot. 39 Roosevelt St is a home located in Bristol County with nearby schools including Acushnet Elementary School, Albert F Ford Middle School, and Alma Del Mar Charter School.
Ownership History
Date
Name
Owned For
Owner Type
Purchase Details
Closed on
May 26, 2000
Sold by
Perry Carol A
Bought by
Mello Janice
Current Estimated Value
Home Financials for this Owner
Home Financials are based on the most recent Mortgage that was taken out on this home.
Original Mortgage
$41,300
Interest Rate
8.1%
Mortgage Type
Purchase Money Mortgage
Create a Home Valuation Report for This Property
The Home Valuation Report is an in-depth analysis detailing your home's value as well as a comparison with similar homes in the area
Home Values in the Area
Average Home Value in this Area
Purchase History
| Date | Buyer | Sale Price | Title Company |
|---|---|---|---|
| Mello Janice | $129,900 | -- |
Source: Public Records
Mortgage History
| Date | Status | Borrower | Loan Amount |
|---|---|---|---|
| Open | Mello Janice | $48,800 | |
| Closed | Mello Janice | $41,300 | |
| Previous Owner | Mello Janice | $67,500 |
Source: Public Records
Tax History
| Year | Tax Paid | Tax Assessment Tax Assessment Total Assessment is a certain percentage of the fair market value that is determined by local assessors to be the total taxable value of land and additions on the property. | Land | Improvement |
|---|---|---|---|---|
| 2025 | $34 | $317,300 | $94,900 | $222,400 |
| 2024 | $3,345 | $293,200 | $90,700 | $202,500 |
| 2023 | $3,376 | $281,300 | $82,500 | $198,800 |
| 2022 | $3,345 | $252,100 | $78,400 | $173,700 |
| 2021 | $3,102 | $224,300 | $78,400 | $145,900 |
| 2020 | $3,127 | $224,300 | $78,400 | $145,900 |
| 2019 | $3,020 | $213,000 | $78,400 | $134,600 |
| 2018 | $2,926 | $202,900 | $78,400 | $124,500 |
| 2017 | $2,824 | $195,600 | $78,400 | $117,200 |
| 2016 | $2,842 | $195,600 | $78,400 | $117,200 |
| 2015 | $2,613 | $183,000 | $78,400 | $104,600 |
Source: Public Records
Map
Nearby Homes
- 14 Hayes St Unit 1
- 12 Hayes St Unit 1
- 11 Boylston St
- 12 White St
- 0 Hathaway Rd Unit 73469544
- 91 S Main St
- 23 Oliveira Ave
- 122 Truro St
- 81 Sylvia St
- 25 Pershing Ave
- 112 Lawson Ave
- 20 Jake Ln
- 4 Sam St
- 34 Chicopee St
- 5 William St
- 14 Caswell St
- 27 Meadow Ln
- 15 Ball St
- 1940-1942 Acushnet Ave
- 65 Armsby St
Your Personal Tour Guide
Ask me questions while you tour the home.