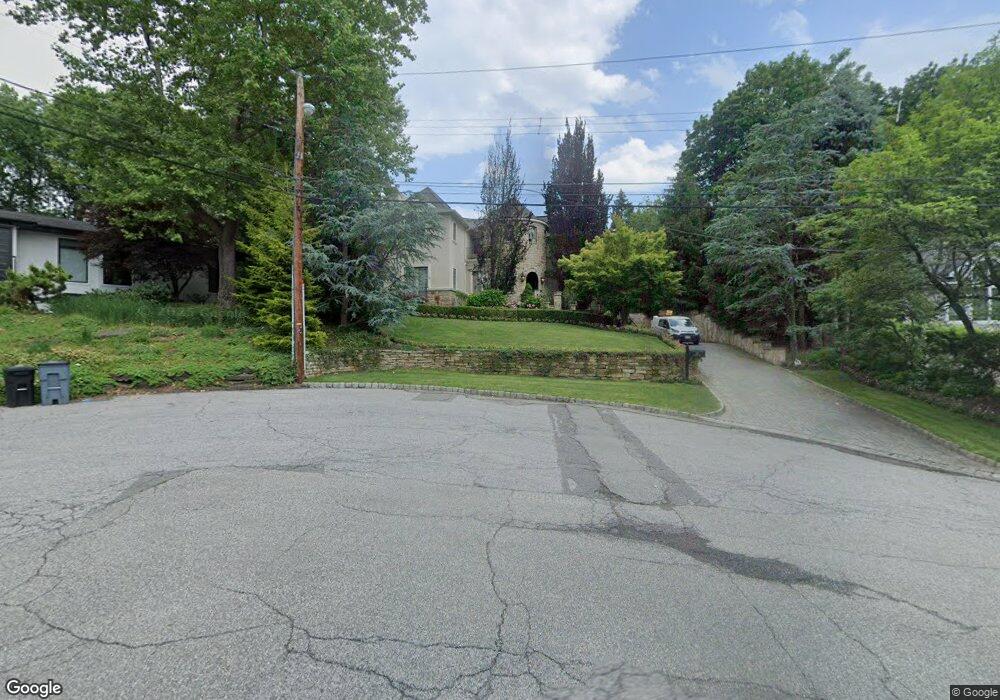
39 Royden Rd Tenafly, NJ 07670
Estimated Value: $3,219,652 - $4,978,000
Studio
--
Bath
4,286
Sq Ft
$925/Sq Ft
Est. Value
About This Home
This home is located at 39 Royden Rd, Tenafly, NJ 07670 and is currently estimated at $3,962,913, approximately $924 per square foot. 39 Royden Rd is a home located in Bergen County with nearby schools including Tenafly Middle School, Tenafly High School, and Spring School.
Ownership History
Date
Name
Owned For
Owner Type
Purchase Details
Closed on
Aug 8, 2012
Sold by
Chuchalov Alexander
Bought by
Gabriel Abdulahad and Gabriel Christine
Current Estimated Value
Purchase Details
Closed on
Jul 1, 2011
Sold by
Chuchalov Alexander
Bought by
Dakin Gregory and Teng Marita
Purchase Details
Closed on
Jan 1, 2007
Sold by
A And G Investment Llc
Bought by
Chuchalov Alexander
Home Financials for this Owner
Home Financials are based on the most recent Mortgage that was taken out on this home.
Original Mortgage
$380,000
Interest Rate
6.18%
Purchase Details
Closed on
Jan 28, 2004
Sold by
Dombi Christa
Bought by
A&G Investment
Create a Home Valuation Report for This Property
The Home Valuation Report is an in-depth analysis detailing your home's value as well as a comparison with similar homes in the area
Home Values in the Area
Average Home Value in this Area
Purchase History
| Date | Buyer | Sale Price | Title Company |
|---|---|---|---|
| Gabriel Abdulahad | $2,450,000 | -- | |
| Dakin Gregory | $2,085,000 | -- | |
| Chuchalov Alexander | -- | -- | |
| A&G Investment | $450,000 | -- |
Source: Public Records
Mortgage History
| Date | Status | Borrower | Loan Amount |
|---|---|---|---|
| Previous Owner | Chuchalov Alexander | $380,000 |
Source: Public Records
Tax History
| Year | Tax Paid | Tax Assessment Tax Assessment Total Assessment is a certain percentage of the fair market value that is determined by local assessors to be the total taxable value of land and additions on the property. | Land | Improvement |
|---|---|---|---|---|
| 2025 | $61,667 | $2,170,600 | $817,700 | $1,352,900 |
| 2024 | $60,169 | $2,170,600 | $817,700 | $1,352,900 |
| 2023 | $58,715 | $2,170,600 | $817,700 | $1,352,900 |
| 2022 | $58,715 | $2,170,600 | $817,700 | $1,352,900 |
| 2021 | $57,673 | $2,170,600 | $817,700 | $1,352,900 |
| 2020 | $56,826 | $2,170,600 | $817,700 | $1,352,900 |
| 2019 | $55,828 | $2,170,600 | $817,700 | $1,352,900 |
| 2018 | $54,960 | $2,170,600 | $817,700 | $1,352,900 |
| 2017 | $54,764 | $2,170,600 | $817,700 | $1,352,900 |
| 2016 | $53,679 | $2,170,600 | $817,700 | $1,352,900 |
| 2015 | $52,485 | $2,170,600 | $817,700 | $1,352,900 |
| 2014 | $51,508 | $2,170,600 | $817,700 | $1,352,900 |
Source: Public Records
Map
Nearby Homes
Your Personal Tour Guide
Ask me questions while you tour the home.