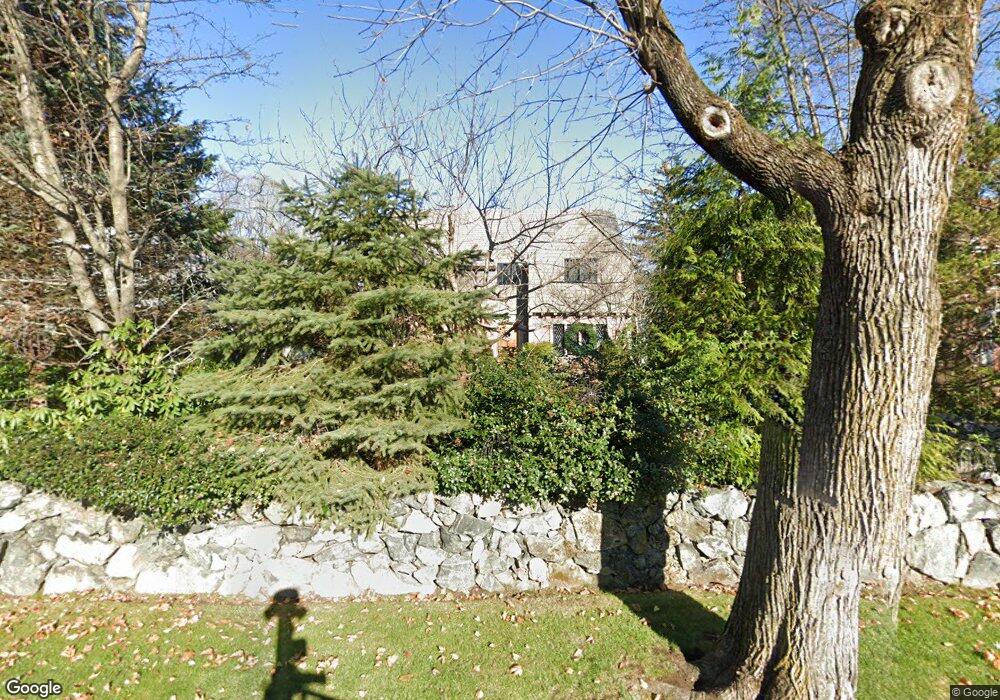
39 Rutledge Rd Belmont, MA 02478
Belmont Hill NeighborhoodEstimated Value: $2,244,000 - $2,530,000
3
Beds
3
Baths
2,806
Sq Ft
$851/Sq Ft
Est. Value
About This Home
This home is located at 39 Rutledge Rd, Belmont, MA 02478 and is currently estimated at $2,388,333, approximately $851 per square foot. 39 Rutledge Rd is a home located in Middlesex County with nearby schools including Winn Brook Elementary School, Winthrop L Chenery Middle School, and Belmont High School.
Ownership History
Date
Name
Owned For
Owner Type
Purchase Details
Closed on
Dec 10, 2013
Sold by
Mcmillan William and Mcmillan Mary E
Bought by
Dean Brett W and Dean Kristen M
Current Estimated Value
Purchase Details
Closed on
Nov 5, 2013
Sold by
Basile Domenic J and Mcmillan Mary E
Bought by
Mcmillian William C and Mcmillan Mary E
Purchase Details
Closed on
Aug 12, 2013
Sold by
Mcmillan Rt and Mcmillan William C
Bought by
Mcmillan Mary E and Basile Domenic J
Home Financials for this Owner
Home Financials are based on the most recent Mortgage that was taken out on this home.
Original Mortgage
$373,250
Interest Rate
3%
Mortgage Type
Adjustable Rate Mortgage/ARM
Purchase Details
Closed on
Aug 12, 1999
Sold by
Phillips Leonard H
Bought by
Mcmillan William and Mcmillan Mary E
Create a Home Valuation Report for This Property
The Home Valuation Report is an in-depth analysis detailing your home's value as well as a comparison with similar homes in the area
Home Values in the Area
Average Home Value in this Area
Purchase History
| Date | Buyer | Sale Price | Title Company |
|---|---|---|---|
| Dean Brett W | $1,300,000 | -- | |
| Mcmillian William C | -- | -- | |
| Mcmillan Mary E | -- | -- | |
| Mcmillan William | $605,000 | -- |
Source: Public Records
Mortgage History
| Date | Status | Borrower | Loan Amount |
|---|---|---|---|
| Previous Owner | Mcmillan Mary E | $373,250 | |
| Previous Owner | Mcmillan William | $175,000 | |
| Previous Owner | Mcmillan William | $100,000 | |
| Previous Owner | Mcmillan William | $50,000 |
Source: Public Records
Tax History
| Year | Tax Paid | Tax Assessment Tax Assessment Total Assessment is a certain percentage of the fair market value that is determined by local assessors to be the total taxable value of land and additions on the property. | Land | Improvement |
|---|---|---|---|---|
| 2025 | $28,726 | $2,522,000 | $802,000 | $1,720,000 |
| 2024 | $24,372 | $2,308,000 | $945,000 | $1,363,000 |
| 2023 | $24,267 | $2,159,000 | $917,000 | $1,242,000 |
| 2022 | $23,640 | $2,045,000 | $887,000 | $1,158,000 |
| 2021 | $5,611 | $2,115,000 | $1,045,000 | $1,070,000 |
| 2020 | $5,446 | $1,843,000 | $798,000 | $1,045,000 |
| 2019 | $19,197 | $1,645,000 | $676,000 | $969,000 |
| 2018 | $18,796 | $1,547,000 | $587,000 | $960,000 |
| 2017 | $18,604 | $1,466,000 | $513,000 | $953,000 |
| 2016 | $16,667 | $1,327,000 | $513,000 | $814,000 |
| 2015 | $16,383 | $1,270,000 | $457,000 | $813,000 |
Source: Public Records
Map
Nearby Homes
- 2 Bellevue Rd
- 27 Stella Rd
- 9 Venner Rd
- 10 Lamoine St
- 11 Menotomy Rocks Dr
- 93 Churchill Ave
- 315 Lake St
- 115 Gloucester St
- 21 Wellington Ln
- 75 Statler Rd
- 164 Hillside Ave
- 23 Newman Way Unit 1
- 23 Centre Ave
- 990 Mass Ave Unit E80
- 135 Marsh St
- 53 Crestview Rd
- 314 Channing Rd
- 995 Massachusetts Ave Unit 404
- 1025 Massachusetts Ave Unit 204
- 1025 Massachusetts Ave Unit 304
- 45 Rutledge Rd
- 31 Rutledge Rd
- 51 Rutledge Rd
- 78 Radcliffe Rd
- 23 Rutledge Rd
- 84 Radcliffe Rd
- 72 Radcliffe Rd
- 90 Radcliffe Rd
- 36 Rutledge Rd
- 30 Rutledge Rd
- 42 Rutledge Rd
- 19 Rutledge Rd
- 24 Rutledge Rd
- 66 Radcliffe Rd
- 96 Radcliffe Rd
- 63 Rutledge Rd
- 89 Clairemont Rd
- 62 Radcliffe Rd
- 16 Rutledge Rd
- 100 Clairemont Rd
Your Personal Tour Guide
Ask me questions while you tour the home.