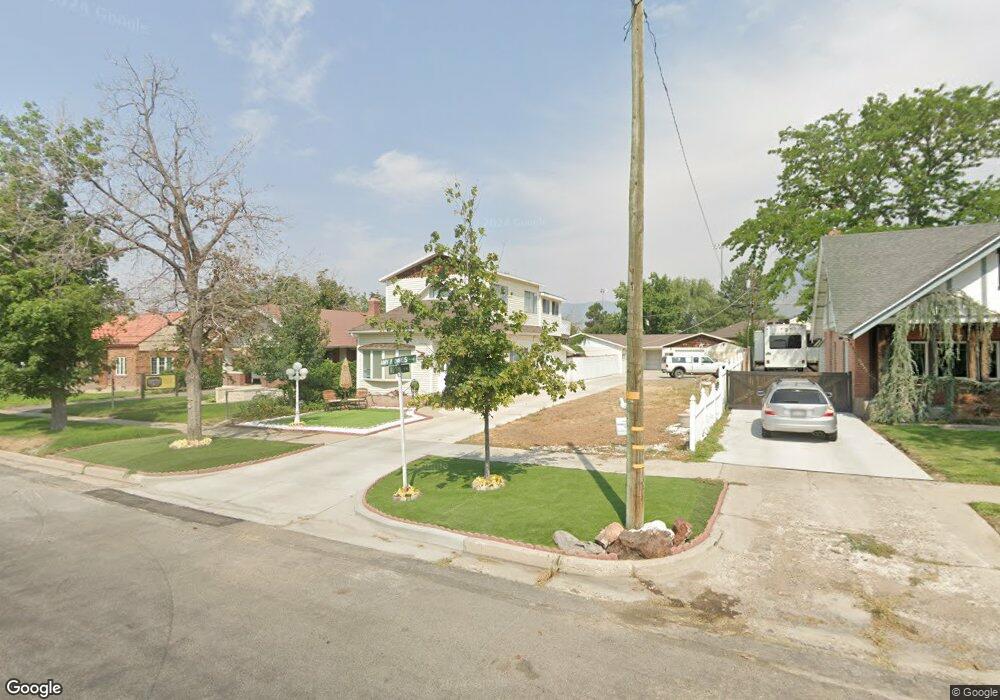
39 S 100 E Tooele, UT 84074
Estimated Value: $371,000 - $408,000
Studio
--
Bath
1,778
Sq Ft
$218/Sq Ft
Est. Value
About This Home
This home is located at 39 S 100 E, Tooele, UT 84074 and is currently estimated at $388,333, approximately $218 per square foot. 39 S 100 E is a home with nearby schools including Sterling Elementary School, Tooele Junior High School, and Tooele High School.
Ownership History
Date
Name
Owned For
Owner Type
Purchase Details
Closed on
Aug 22, 2024
Sold by
Royal David L and Royal Amy L
Bought by
Royal Living Trust and Royal
Current Estimated Value
Create a Home Valuation Report for This Property
The Home Valuation Report is an in-depth analysis detailing your home's value as well as a comparison with similar homes in the area
Purchase History
| Date | Buyer | Sale Price | Title Company |
|---|---|---|---|
| Royal Living Trust | -- | Meridian Title |
Source: Public Records
Tax History
| Year | Tax Paid | Tax Assessment Tax Assessment Total Assessment is a certain percentage of the fair market value that is determined by local assessors to be the total taxable value of land and additions on the property. | Land | Improvement |
|---|---|---|---|---|
| 2024 | $2,439 | $186,154 | $41,773 | $144,381 |
| 2023 | $2,439 | $172,998 | $40,825 | $132,173 |
| 2022 | $2,349 | $202,103 | $53,130 | $148,973 |
| 2021 | $2,026 | $145,770 | $35,420 | $110,350 |
| 2020 | $1,887 | $235,575 | $34,938 | $200,637 |
| 2019 | $1,705 | $209,405 | $34,938 | $174,467 |
| 2018 | $1,604 | $186,710 | $35,000 | $151,710 |
| 2017 | $1,329 | $173,894 | $35,250 | $138,644 |
| 2015 | -- | $83,261 | $0 | $0 |
| 2014 | -- | $83,261 | $0 | $0 |
Source: Public Records
Map
Nearby Homes
- 175 E Vine St
- 156 S 200 E
- 179 S 179 S 200 E
- 141 N Pinehurst Ave
- 106 N 1st St
- 268 E Vine St
- 124 N 1st St
- 220 S Main St
- 47 S 3rd St
- 330 S 100 E
- 77 N 4th St
- 103 N 4th St
- 48 N 200 W
- 197 W 100 S
- 440 Highland Dr
- 354 S 100 W
- 422 S Main St
- 1757 N Patchwork Ave Unit 1262
- 1763 N Patchwork Ave Unit 1260
- 292 N 100 W
Your Personal Tour Guide
Ask me questions while you tour the home.