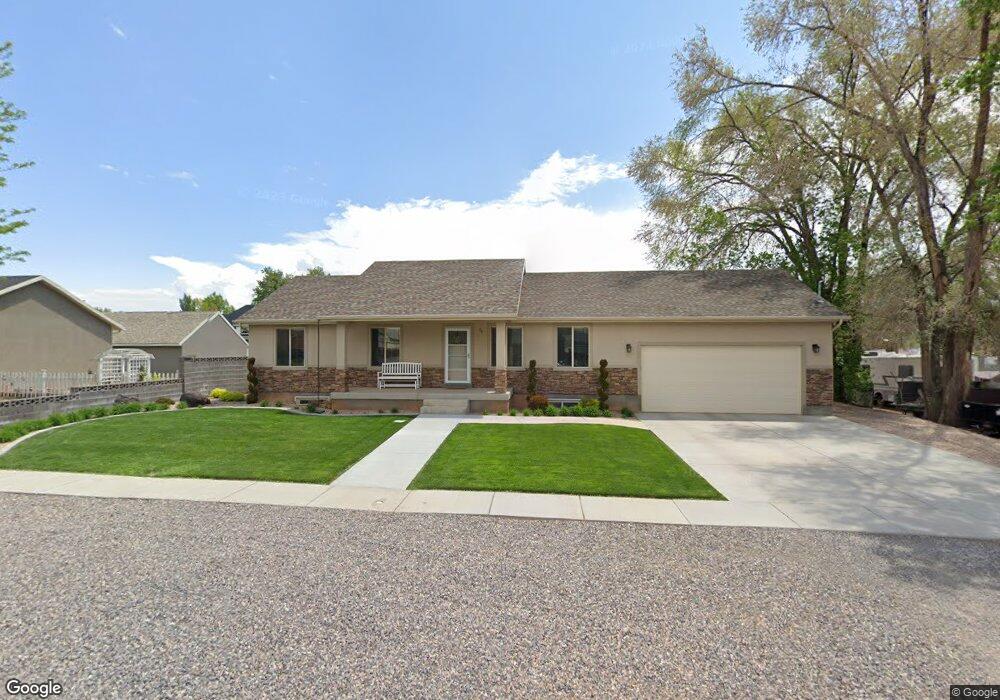
39 S 400 E Richfield, UT 84701
Estimated Value: $291,000 - $347,000
Studio
--
Bath
1,197
Sq Ft
$270/Sq Ft
Est. Value
About This Home
This home is located at 39 S 400 E, Richfield, UT 84701 and is currently estimated at $323,205, approximately $270 per square foot. 39 S 400 E is a home with nearby schools including Ashman School, Pahvant School, and Red Hills Middle School.
Ownership History
Date
Name
Owned For
Owner Type
Purchase Details
Closed on
Aug 21, 2023
Sold by
Mason Drake S and Mason Shakari
Bought by
Perry Skyler Kent and Syddall Shelbee Lynn
Current Estimated Value
Home Financials for this Owner
Home Financials are based on the most recent Mortgage that was taken out on this home.
Original Mortgage
$375,571
Outstanding Balance
$365,902
Interest Rate
6.81%
Mortgage Type
FHA
Estimated Equity
-$42,697
Purchase Details
Closed on
Apr 14, 2014
Sold by
Mason Scott and Mason Cinda
Bought by
Mason Drake S and Mason Shakari
Create a Home Valuation Report for This Property
The Home Valuation Report is an in-depth analysis detailing your home's value as well as a comparison with similar homes in the area
Purchase History
| Date | Buyer | Sale Price | Title Company |
|---|---|---|---|
| Perry Skyler Kent | -- | Professional Title | |
| Mason Drake S | -- | Utah Title & Abstract |
Source: Public Records
Mortgage History
| Date | Status | Borrower | Loan Amount |
|---|---|---|---|
| Open | Perry Skyler Kent | $375,571 |
Source: Public Records
Tax History
| Year | Tax Paid | Tax Assessment Tax Assessment Total Assessment is a certain percentage of the fair market value that is determined by local assessors to be the total taxable value of land and additions on the property. | Land | Improvement |
|---|---|---|---|---|
| 2025 | $1,885 | $194,186 | $40,286 | $153,900 |
| 2024 | $1,885 | $196,027 | $33,028 | $162,999 |
| 2023 | $1,939 | $208,395 | $30,455 | $177,940 |
| 2022 | $1,841 | $168,079 | $25,752 | $142,327 |
| 2021 | $1,818 | $139,702 | $26,677 | $113,025 |
| 2020 | $1,786 | $133,443 | $18,533 | $114,910 |
| 2019 | $1,528 | $120,850 | $15,440 | $105,410 |
| 2018 | $1,571 | $111,350 | $15,440 | $95,910 |
| 2017 | $1,552 | $105,010 | $15,440 | $89,570 |
| 2016 | $230 | $105,010 | $0 | $0 |
| 2015 | $230 | $103,970 | $0 | $0 |
| 2014 | $230 | $99,470 | $0 | $0 |
Source: Public Records
Map
Nearby Homes
Your Personal Tour Guide
Ask me questions while you tour the home.