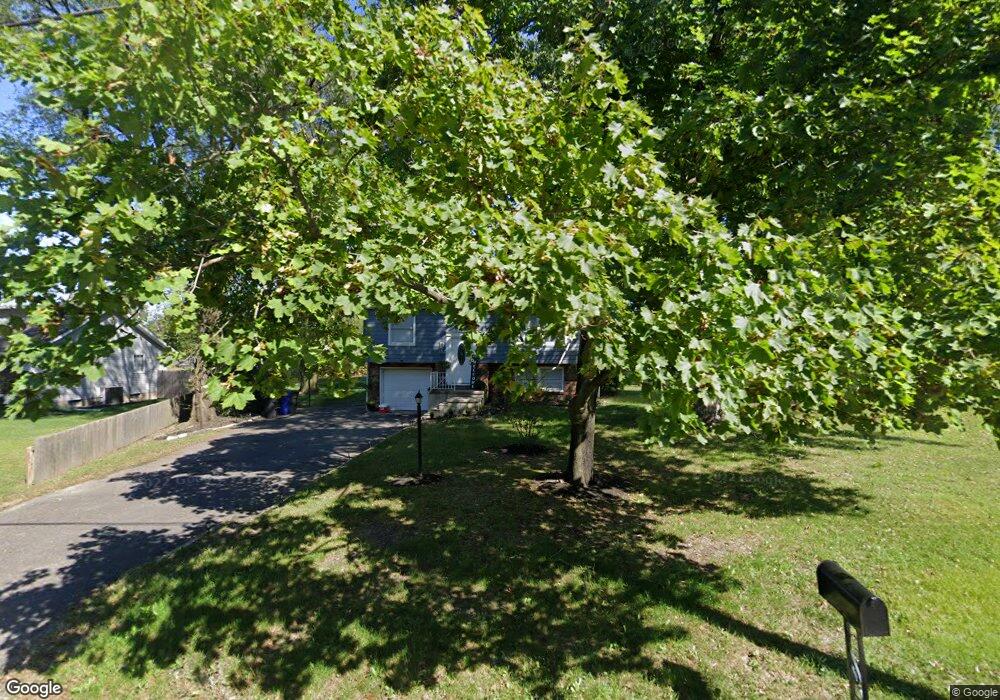
39 S Chew Rd Hammonton, NJ 08037
Estimated Value: $269,812 - $407,000
--
Bed
--
Bath
1,528
Sq Ft
$214/Sq Ft
Est. Value
About This Home
This home is located at 39 S Chew Rd, Hammonton, NJ 08037 and is currently estimated at $326,453, approximately $213 per square foot. 39 S Chew Rd is a home located in Atlantic County with nearby schools including Hammonton Early Childhood Education Center, Warren E. Sooy Jr. Elementary School, and Hammonton Middle School.
Ownership History
Date
Name
Owned For
Owner Type
Purchase Details
Closed on
Aug 1, 2016
Sold by
Tower Property Group Llc
Bought by
Parvin Group Llc
Current Estimated Value
Purchase Details
Closed on
Oct 1, 2015
Sold by
Wooton Kevin and Wooton Vickie
Bought by
Tower Property Group Llc
Purchase Details
Closed on
Apr 10, 2015
Sold by
Merlino Edna and Frye Edna
Bought by
Wooton Vickie and Wooton Kevin
Purchase Details
Closed on
Dec 16, 1976
Bought by
Frye Edna Merlino
Create a Home Valuation Report for This Property
The Home Valuation Report is an in-depth analysis detailing your home's value as well as a comparison with similar homes in the area
Home Values in the Area
Average Home Value in this Area
Purchase History
| Date | Buyer | Sale Price | Title Company |
|---|---|---|---|
| Parvin Group Llc | -- | None Available | |
| Tower Property Group Llc | $60,000 | World Title Agency | |
| Wooton Vickie | -- | Attorney | |
| Frye Edna Merlino | -- | -- |
Source: Public Records
Tax History Compared to Growth
Tax History
| Year | Tax Paid | Tax Assessment Tax Assessment Total Assessment is a certain percentage of the fair market value that is determined by local assessors to be the total taxable value of land and additions on the property. | Land | Improvement |
|---|---|---|---|---|
| 2025 | $4,189 | $152,200 | $55,500 | $96,700 |
| 2024 | $4,189 | $152,200 | $55,500 | $96,700 |
| 2023 | $4,144 | $152,200 | $55,500 | $96,700 |
| 2022 | $4,144 | $152,200 | $55,500 | $96,700 |
| 2021 | $4,160 | $152,200 | $55,500 | $96,700 |
| 2020 | $4,138 | $152,200 | $55,500 | $96,700 |
| 2019 | $4,123 | $152,200 | $55,500 | $96,700 |
| 2018 | $4,103 | $152,200 | $55,500 | $96,700 |
| 2017 | $4,045 | $152,200 | $55,500 | $96,700 |
| 2016 | $3,898 | $152,200 | $55,500 | $96,700 |
| 2015 | $3,784 | $152,200 | $55,500 | $96,700 |
| 2014 | $3,546 | $95,600 | $31,300 | $64,300 |
Source: Public Records
Map
Nearby Homes