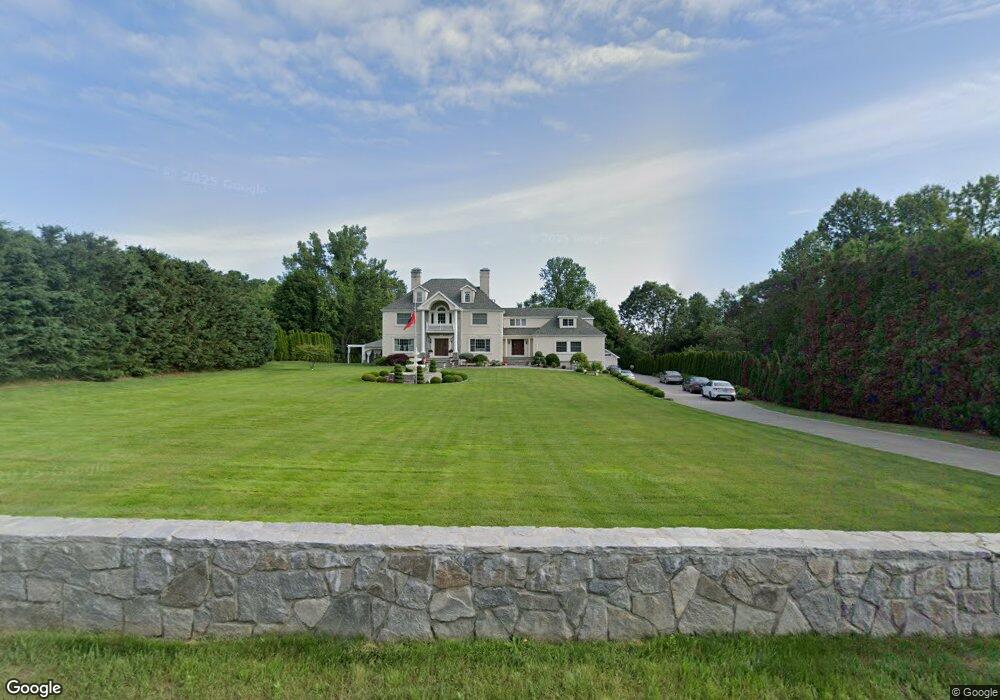
39 Sagamore Dr Seymour, CT 06483
Estimated Value: $685,000 - $857,000
5
Beds
5
Baths
5,364
Sq Ft
$148/Sq Ft
Est. Value
About This Home
This home is located at 39 Sagamore Dr, Seymour, CT 06483 and is currently estimated at $794,807, approximately $148 per square foot. 39 Sagamore Dr is a home located in New Haven County with nearby schools including Bungay Elementary School, Seymour Middle School, and Seymour High School.
Ownership History
Date
Name
Owned For
Owner Type
Purchase Details
Closed on
Feb 17, 2016
Sold by
Peraj Blerim
Bought by
Peraj Blerim and Peraj Liljana
Current Estimated Value
Purchase Details
Closed on
Jun 27, 2005
Sold by
Underhill Peter K
Bought by
Peraj Blerim and Isufaj Maksim
Purchase Details
Closed on
Nov 21, 2002
Sold by
Cerretani Nicholas
Bought by
Underhill Peter K
Create a Home Valuation Report for This Property
The Home Valuation Report is an in-depth analysis detailing your home's value as well as a comparison with similar homes in the area
Home Values in the Area
Average Home Value in this Area
Purchase History
| Date | Buyer | Sale Price | Title Company |
|---|---|---|---|
| Peraj Blerim | -- | -- | |
| Peraj Blerim | -- | -- | |
| Peraj Blerim | $404,500 | -- | |
| Peraj Blerim | $404,500 | -- | |
| Underhill Peter K | $365,000 | -- |
Source: Public Records
Mortgage History
| Date | Status | Borrower | Loan Amount |
|---|---|---|---|
| Previous Owner | Underhill Peter K | $370,000 | |
| Previous Owner | Underhill Peter K | $400,000 |
Source: Public Records
Tax History Compared to Growth
Tax History
| Year | Tax Paid | Tax Assessment Tax Assessment Total Assessment is a certain percentage of the fair market value that is determined by local assessors to be the total taxable value of land and additions on the property. | Land | Improvement |
|---|---|---|---|---|
| 2025 | $15,038 | $542,500 | $59,920 | $482,580 |
| 2024 | $17,510 | $475,300 | $60,410 | $414,890 |
| 2023 | $17,101 | $475,300 | $60,410 | $414,890 |
| 2022 | $16,916 | $475,300 | $60,410 | $414,890 |
| 2021 | $16,498 | $475,300 | $60,410 | $414,890 |
| 2020 | $15,211 | $422,520 | $70,910 | $351,610 |
| 2019 | $15,211 | $422,520 | $70,910 | $351,610 |
| 2018 | $15,211 | $422,520 | $70,910 | $351,610 |
| 2017 | $15,211 | $422,520 | $70,910 | $351,610 |
| 2016 | $15,211 | $422,520 | $70,910 | $351,610 |
| 2015 | $13,959 | $403,550 | $77,910 | $325,640 |
| 2014 | $13,737 | $403,550 | $77,910 | $325,640 |
Source: Public Records
Map
Nearby Homes
- 92 Balance Rock Rd Unit 9
- 28 Brook St
- 26 Balance Rock Rd Unit 16
- 4 Brook St
- 22 Frances Dr
- 37-14, 49-1, 79-2, 7 Balance Rock Rd
- 11 Oxford Rd
- 9 Stanley Dr
- 202 W Church St
- 36 Bungay Terrace
- 4 Nickel Mine Dr
- 4 Mead Farm Rd
- 3 Deer Run Dr
- 50 Bissell Place
- 61 Pershing Ave
- 29 George St
- 139 Derby Ave
- 6 Park Rd
- 30 Park Rd
- 73 Botsford Rd