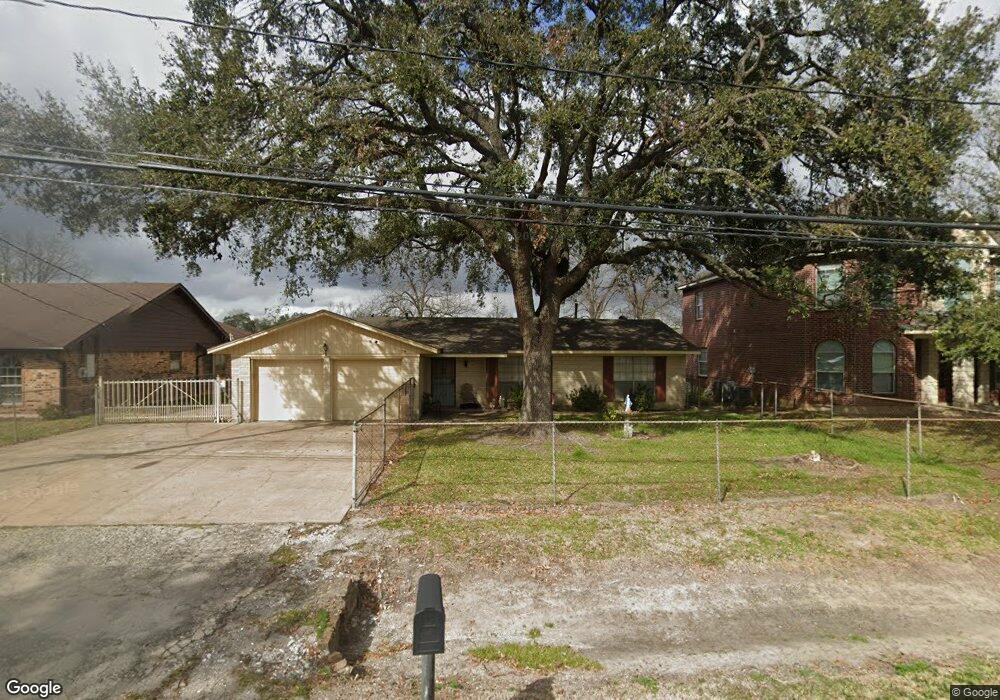
39 Salerno Ln Houston, TX 77076
Northside-Northline NeighborhoodEstimated Value: $174,000 - $356,000
3
Beds
2
Baths
1,552
Sq Ft
$179/Sq Ft
Est. Value
About This Home
This home is located at 39 Salerno Ln, Houston, TX 77076 and is currently estimated at $277,126, approximately $178 per square foot. 39 Salerno Ln is a home located in Harris County with nearby schools including Lyons Elementary School, Fonville Middle School, and Sam Houston Math, Science & Technology Center.
Ownership History
Date
Name
Owned For
Owner Type
Purchase Details
Closed on
Feb 27, 2012
Sold by
Fontana Santo
Bought by
Fontana Santo
Current Estimated Value
Purchase Details
Closed on
Jun 23, 1998
Sold by
Tautenhahn Mary Jane and Jones Mary Jane
Bought by
Warner Deborah J
Home Financials for this Owner
Home Financials are based on the most recent Mortgage that was taken out on this home.
Original Mortgage
$36,000
Outstanding Balance
$7,302
Interest Rate
7.21%
Estimated Equity
$269,824
Create a Home Valuation Report for This Property
The Home Valuation Report is an in-depth analysis detailing your home's value as well as a comparison with similar homes in the area
Home Values in the Area
Average Home Value in this Area
Purchase History
| Date | Buyer | Sale Price | Title Company |
|---|---|---|---|
| Fontana Santo | -- | None Available | |
| Warner Deborah J | -- | Commonwealth Land Title Co |
Source: Public Records
Mortgage History
| Date | Status | Borrower | Loan Amount |
|---|---|---|---|
| Open | Warner Deborah J | $36,000 |
Source: Public Records
Tax History Compared to Growth
Tax History
| Year | Tax Paid | Tax Assessment Tax Assessment Total Assessment is a certain percentage of the fair market value that is determined by local assessors to be the total taxable value of land and additions on the property. | Land | Improvement |
|---|---|---|---|---|
| 2025 | $41 | $296,669 | $141,244 | $155,425 |
| 2024 | $41 | $306,833 | $141,244 | $165,589 |
| 2023 | $41 | $271,017 | $136,688 | $134,329 |
| 2022 | $3,901 | $240,792 | $106,313 | $134,479 |
| 2021 | $3,754 | $170,000 | $55,688 | $114,312 |
| 2020 | $3,545 | $160,000 | $55,688 | $104,312 |
| 2019 | $3,368 | $179,030 | $55,688 | $123,342 |
| 2018 | $342 | $133,987 | $40,500 | $93,487 |
| 2017 | $2,781 | $133,987 | $40,500 | $93,487 |
| 2016 | $3,049 | $129,051 | $40,500 | $88,551 |
| 2015 | $519 | $109,627 | $40,500 | $69,127 |
| 2014 | $519 | $109,627 | $40,500 | $69,127 |
Source: Public Records
Map
Nearby Homes
- 10202 Fulton St
- 10135 Fulton St
- 10210 Fulton St
- 10245 O Donnell Dr
- 10041 Fulton St
- 904 Ellena Rd Unit 16
- 59 E Sunnyside St
- 153 Treasure Dr
- 129 E Sunnyside St
- 9815 Fulton Park Ln
- 9910 Fulton St
- 9813 Fulton Park Ln
- 9905 Fulton St
- 7 Parker Rd Unit 12
- 64 Dipping Ln
- 9215 Plan at Fulton Crossing
- 9289 Plan at Fulton Crossing
- 9293 Plan at Fulton Crossing
- 9236 Plan at Fulton Crossing
- 40 Dipping Ln