39 Selkirk Rd Cranston, RI 02905
Edgewood NeighborhoodEstimated Value: $995,668 - $1,295,000
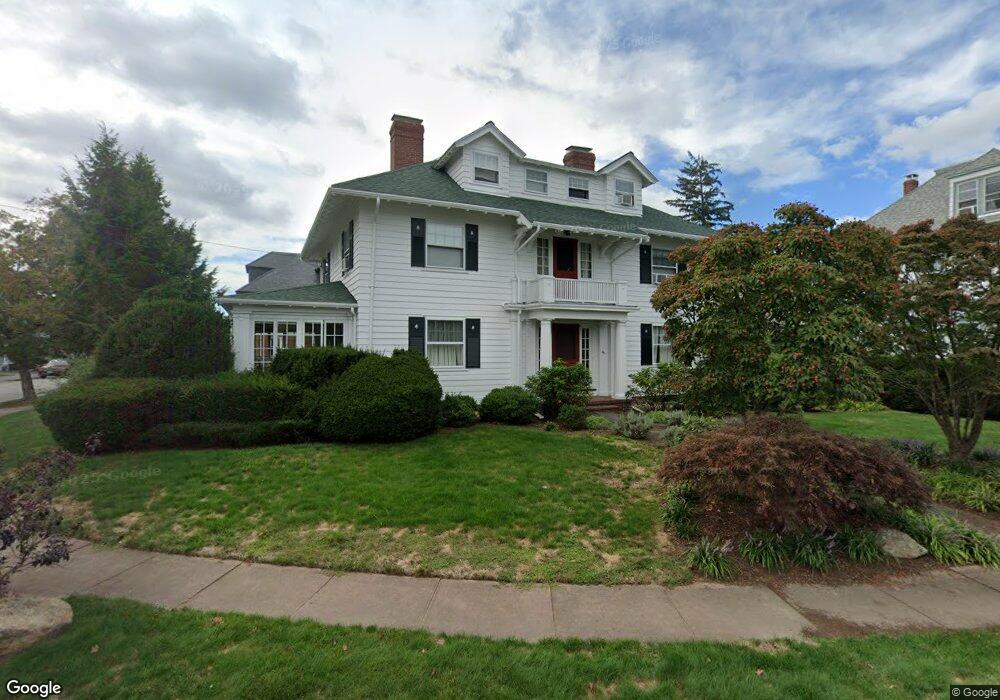
About This Home
This home is located at 39 Selkirk Rd, Cranston, RI 02905 and is currently estimated at $1,111,667, approximately $294 per square foot. 39 Selkirk Rd is a home located in Providence County with nearby schools including Edward S. Rhodes School, Park View Middle School, and Cranston High School East.
Ownership History
We collect this data history from publicly available records. To have your information removed, we recommend requesting removal directly through your county’s website.
Purchase Details
Purchase Details
Purchase Details
Home Values in the Area
Average Home Value in this Area
Purchase History
We collect this data history from publicly available records. To have your information removed, we recommend requesting removal directly through your county’s website.
| Date | Buyer | Sale Price | Title Company |
|---|---|---|---|
| $650,000 | -- | ||
| $275,000 | -- | ||
| $250,000 | -- |
Mortgage History
We collect this data history from publicly available records. To have your information removed, we recommend requesting removal directly through your county’s website.
| Date | Status | Borrower | Loan Amount |
|---|---|---|---|
| Open | $248,000 | ||
| Closed | $324,250 | ||
| Previous Owner | $850,000 | ||
| Previous Owner | $35,000 | ||
| Previous Owner | $184,000 | ||
| Previous Owner | $202,500 | ||
| Previous Owner | $214,500 |
Tax History
We collect this data history from publicly available records. To have your information removed, we recommend requesting removal directly through your county’s website.
| Year | Tax Paid | Tax Assessment Tax Assessment Total Assessment is a certain percentage of the fair market value that is determined by local assessors to be the total taxable value of land and additions on the property. | Land | Improvement |
|---|---|---|---|---|
| 2025 | $11,702 | $843,100 | $276,800 | $566,300 |
| 2024 | $11,475 | $843,100 | $276,800 | $566,300 |
| 2023 | $11,939 | $631,700 | $200,100 | $431,600 |
| 2022 | $11,693 | $631,700 | $200,100 | $431,600 |
| 2021 | $11,371 | $631,700 | $200,100 | $431,600 |
| 2020 | $11,116 | $535,200 | $186,400 | $348,800 |
| 2019 | $11,116 | $535,200 | $186,400 | $348,800 |
| 2018 | $10,859 | $535,200 | $186,400 | $348,800 |
| 2017 | $11,364 | $495,400 | $172,800 | $322,600 |
| 2016 | $11,122 | $495,400 | $172,800 | $322,600 |
| 2015 | $11,122 | $495,400 | $172,800 | $322,600 |
| 2014 | $10,365 | $453,800 | $163,700 | $290,100 |
Map
- 101 Sheldon St
- 70 Tucker Ave
- 33 Sefton Dr
- 26 Fairview Ave
- 37 Remington St
- 28 Rosewood Ave
- 0 Remington St
- 11 Spring Garden St
- 15 Kent Place
- 65 Marion Ave S
- 32 S Fair St
- 200 Post Rd Unit 233
- 200 Post Rd Unit 319
- 15 Bow St
- 24 Rosegarden St
- 18 Harding Ave
- 105 Park Ave
- 118 Arnold Ave
- 169 Arnold Ave Unit B
- 106 Norwood Ave Unit 1
Ask me questions while you tour the home.