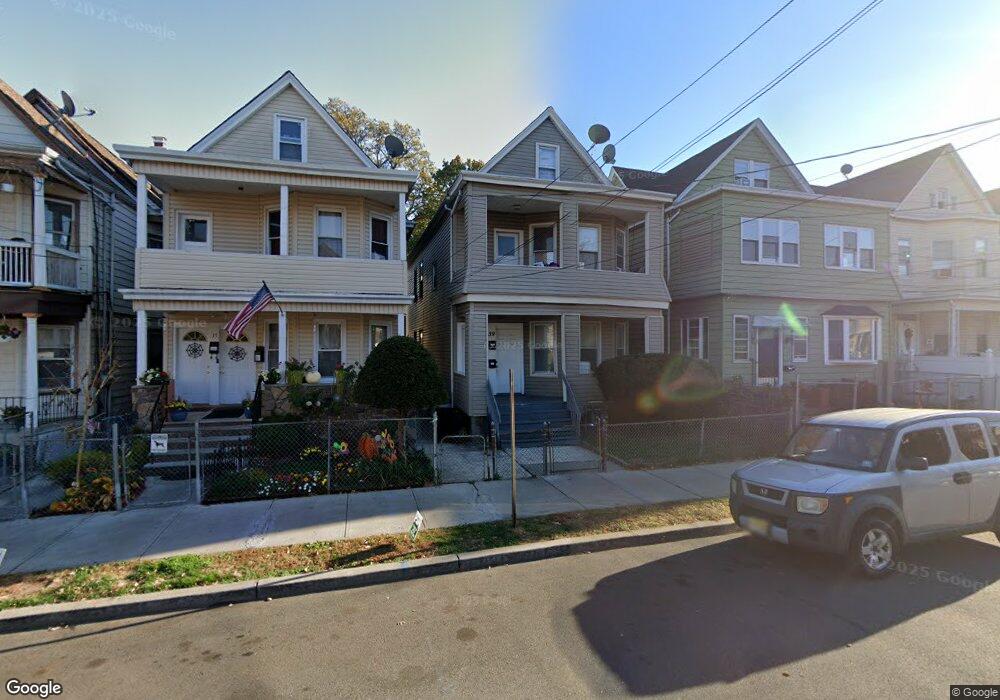
39 Sherman St Unit 2 Passaic, NJ 07055
Estimated Value: $434,000 - $598,000
6
Beds
3
Baths
1,968
Sq Ft
$263/Sq Ft
Est. Value
About This Home
This home is located at 39 Sherman St Unit 2, Passaic, NJ 07055 and is currently estimated at $516,684, approximately $262 per square foot. 39 Sherman St Unit 2 is a home located in Passaic County with nearby schools including Passaic High School # 12, St Nicholas Ukrainian Catholic School, and Passaic Catholic Regional School.
Ownership History
Date
Name
Owned For
Owner Type
Purchase Details
Closed on
Oct 1, 2019
Sold by
Aguilar Eeladio and Alvarez Heladia
Bought by
Kopic Marko
Current Estimated Value
Purchase Details
Closed on
May 26, 2006
Sold by
Montesino Felix R
Bought by
Aguilar Eladio
Home Financials for this Owner
Home Financials are based on the most recent Mortgage that was taken out on this home.
Original Mortgage
$316,000
Interest Rate
6.62%
Mortgage Type
New Conventional
Purchase Details
Closed on
Jun 25, 2003
Sold by
Moreno Basilia
Bought by
Montesino Felix
Home Financials for this Owner
Home Financials are based on the most recent Mortgage that was taken out on this home.
Original Mortgage
$229,400
Interest Rate
5.27%
Mortgage Type
FHA
Purchase Details
Closed on
Feb 25, 2002
Sold by
Moreno Pedro
Bought by
Moreno Basilia
Create a Home Valuation Report for This Property
The Home Valuation Report is an in-depth analysis detailing your home's value as well as a comparison with similar homes in the area
Home Values in the Area
Average Home Value in this Area
Purchase History
| Date | Buyer | Sale Price | Title Company |
|---|---|---|---|
| Kopic Marko | $236,000 | None Available | |
| Aguilar Eladio | $395,000 | -- | |
| Montesino Felix | $233,000 | -- | |
| Moreno Basilia | $55,000 | -- |
Source: Public Records
Mortgage History
| Date | Status | Borrower | Loan Amount |
|---|---|---|---|
| Previous Owner | Aguilar Eladio | $316,000 | |
| Previous Owner | Montesino Felix | $229,400 |
Source: Public Records
Tax History
| Year | Tax Paid | Tax Assessment Tax Assessment Total Assessment is a certain percentage of the fair market value that is determined by local assessors to be the total taxable value of land and additions on the property. | Land | Improvement |
|---|---|---|---|---|
| 2025 | $9,153 | $222,000 | $64,700 | $157,300 |
| 2024 | $8,889 | $222,000 | $64,700 | $157,300 |
| 2022 | $8,622 | $222,000 | $64,700 | $157,300 |
| 2021 | $8,347 | $222,000 | $64,700 | $157,300 |
| 2020 | $8,283 | $222,000 | $64,700 | $157,300 |
| 2019 | $8,163 | $222,000 | $64,700 | $157,300 |
| 2018 | $7,988 | $222,000 | $64,700 | $157,300 |
| 2017 | $7,741 | $222,000 | $64,700 | $157,300 |
| 2016 | $7,477 | $222,000 | $64,700 | $157,300 |
| 2015 | $8,906 | $117,600 | $48,900 | $68,700 |
| 2014 | $8,742 | $117,600 | $48,900 | $68,700 |
Source: Public Records
Map
Nearby Homes
- 191 Harrison St
- 45 Quincy St
- 190 Columbia Ave
- 247 Hope Ave Aka 251
- 247 Hope Ave
- 13-23 Allen St
- 13 Allen St
- 49 Hope St - Aka 119 Oxford
- 194 Dayton Ave
- 180 Highland Ave Unit 5A
- 25 Burgess Place
- 31 Highland Ave
- 212 4th St
- 153 3rd St
- 204 Central Ave
- 46 Center St
- 15 Harrison Place
- 22 Arthur St
- 1004 Unicorn Way Unit 2
- 47 Durant Ave
Your Personal Tour Guide
Ask me questions while you tour the home.