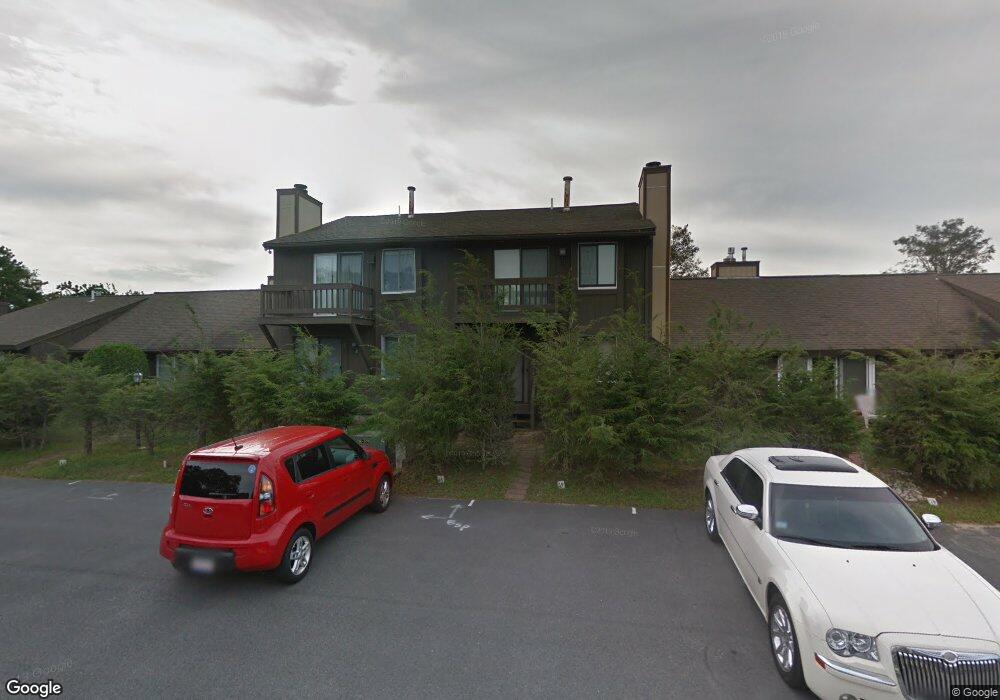
39 Ships View Terrace Bourne, MA 02532
Estimated Value: $287,000 - $325,000
1
Bed
1
Bath
864
Sq Ft
$353/Sq Ft
Est. Value
About This Home
This home is located at 39 Ships View Terrace, Bourne, MA 02532 and is currently estimated at $305,223, approximately $353 per square foot. 39 Ships View Terrace is a home located in Barnstable County with nearby schools including Bourne High School, St Margaret Regional School, and Bridgeview Montessori School.
Ownership History
Date
Name
Owned For
Owner Type
Purchase Details
Closed on
Jun 28, 2019
Sold by
Holmes Catherine V
Bought by
Hieber Christopher
Current Estimated Value
Home Financials for this Owner
Home Financials are based on the most recent Mortgage that was taken out on this home.
Original Mortgage
$160,900
Outstanding Balance
$141,480
Interest Rate
4%
Mortgage Type
New Conventional
Estimated Equity
$163,743
Purchase Details
Closed on
Aug 17, 2005
Sold by
Edith White Rt
Bought by
Holmes Catherine
Home Financials for this Owner
Home Financials are based on the most recent Mortgage that was taken out on this home.
Original Mortgage
$175,920
Interest Rate
5.66%
Purchase Details
Closed on
Jan 9, 2004
Sold by
Gatewood Cynthia M
Bought by
Edith White Rt
Purchase Details
Closed on
Apr 28, 1999
Sold by
Chenard Rose Marie
Bought by
Gatewoood Cynthia M
Home Financials for this Owner
Home Financials are based on the most recent Mortgage that was taken out on this home.
Original Mortgage
$59,920
Interest Rate
6.95%
Mortgage Type
Purchase Money Mortgage
Create a Home Valuation Report for This Property
The Home Valuation Report is an in-depth analysis detailing your home's value as well as a comparison with similar homes in the area
Home Values in the Area
Average Home Value in this Area
Purchase History
| Date | Buyer | Sale Price | Title Company |
|---|---|---|---|
| Hieber Christopher | $166,900 | -- | |
| Holmes Catherine | $219,900 | -- | |
| Edith White Rt | $195,000 | -- | |
| Gatewoood Cynthia M | $74,900 | -- |
Source: Public Records
Mortgage History
| Date | Status | Borrower | Loan Amount |
|---|---|---|---|
| Open | Hieber Christopher | $160,900 | |
| Previous Owner | Holmes Catherine | $175,920 | |
| Previous Owner | Gatewoood Cynthia M | $59,920 |
Source: Public Records
Tax History Compared to Growth
Tax History
| Year | Tax Paid | Tax Assessment Tax Assessment Total Assessment is a certain percentage of the fair market value that is determined by local assessors to be the total taxable value of land and additions on the property. | Land | Improvement |
|---|---|---|---|---|
| 2025 | $2,106 | $269,700 | $0 | $269,700 |
| 2024 | $1,677 | $209,100 | $0 | $209,100 |
| 2023 | $1,630 | $185,000 | $0 | $185,000 |
| 2022 | $1,595 | $158,100 | $0 | $158,100 |
| 2021 | $1,642 | $152,500 | $0 | $152,500 |
| 2020 | $1,598 | $148,800 | $0 | $148,800 |
| 2019 | $1,414 | $134,500 | $0 | $134,500 |
| 2018 | $1,375 | $130,500 | $0 | $130,500 |
| 2017 | $1,365 | $132,500 | $0 | $132,500 |
| 2016 | $1,531 | $150,700 | $0 | $150,700 |
| 2015 | $1,366 | $135,700 | $0 | $135,700 |
Source: Public Records
Map
Nearby Homes
- 24 Ships View Terrace
- 27 Ships View Terrace
- 5 Bosuns Ln
- 4 Mainstay Ln
- 29 Weather Deck Rd
- 7 Mizzen Ln
- 90-92 Sandwich Rd Unit 9C
- 90-92 Sandwich Rd Unit 2
- 60 Sandwich Rd
- 38 Old Bridge Rd
- 85 Waterhouse Rd
- 85 Waterhouse Rd
- 44 Cotuit Rd
- 405 Village Dr
- 405 Village Dr Unit 405
- 4 Finch Ln
- 23 Settlers Way
- 14 Great Rock Rd
- 18 Heather Hill Rd
- 1 Hollyhock Knoll Ct Unit 1
- 43 Ships View Terrace
- 42 Ships View Terrace
- 41 Ships View Terrace
- 39 Ships View Terrace
- 39 Ships View Terrace Unit 39
- 42 Ships View Terrace
- 40 Ships View Terrace
- 41 Ships View Terrace
- 38 Ships View Terrace
- 38 Ships View Terrace
- 38 Ships View Terrace Unit U-38
- 40 Ships View Terrace
- 0 Ships View Ter U44 Unit 44
- 48 Ships View Terrace
- 47 Ships View Terrace
- 46 Ships View Terrace
- 45 Ships View Terrace
- 44 Ships View Terrace
- 48 Ships View Terrace Unit 48
- 47 Ships View Terrace Unit U-47