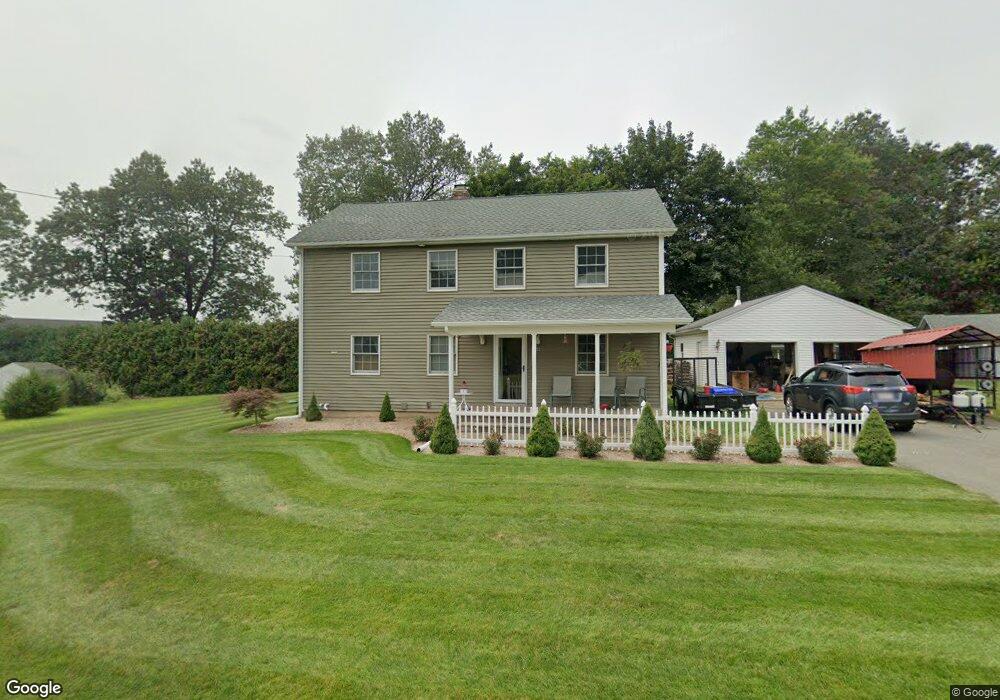
39 Skyridge St Ludlow, MA 01056
Estimated Value: $345,758 - $390,000
4
Beds
1
Bath
1,392
Sq Ft
$263/Sq Ft
Est. Value
About This Home
This home is located at 39 Skyridge St, Ludlow, MA 01056 and is currently estimated at $366,440, approximately $263 per square foot. 39 Skyridge St is a home located in Hampden County with nearby schools including East Street Elementary School, Chapin Street Elementary School, and Paul R. Baird Middle School.
Ownership History
Date
Name
Owned For
Owner Type
Purchase Details
Closed on
Oct 29, 2004
Sold by
Wegiel Keith J and Wegiel Lisa A
Bought by
Lauzon Roland J
Current Estimated Value
Home Financials for this Owner
Home Financials are based on the most recent Mortgage that was taken out on this home.
Original Mortgage
$55,000
Outstanding Balance
$26,027
Interest Rate
5.74%
Mortgage Type
Purchase Money Mortgage
Estimated Equity
$340,413
Purchase Details
Closed on
Mar 2, 2004
Sold by
Fitzgerald Lisa A and Wegiel Lisa A
Bought by
Wegiel Keith J and Wegiel Lisa A
Home Financials for this Owner
Home Financials are based on the most recent Mortgage that was taken out on this home.
Original Mortgage
$306,000
Interest Rate
5.65%
Mortgage Type
Purchase Money Mortgage
Purchase Details
Closed on
Nov 2, 1998
Sold by
Lebrasseur Lance M and Lebrasseur Ellen R
Bought by
Fitzgerald Brian and Fitzgerald Lisa A
Create a Home Valuation Report for This Property
The Home Valuation Report is an in-depth analysis detailing your home's value as well as a comparison with similar homes in the area
Home Values in the Area
Average Home Value in this Area
Purchase History
We collect this data history from publicly available records. To have your information removed, we recommend requesting removal directly through your county’s website.
| Date | Buyer | Sale Price | Title Company |
|---|---|---|---|
| Lauzon Roland J | $187,000 | -- | |
| Lauzon Roland J | $187,000 | -- | |
| Wegiel Keith J | -- | -- | |
| Wegiel Keith J | -- | -- | |
| Wegiel Keith J | -- | -- | |
| Fitzgerald Brian | $108,000 | -- | |
| Fitzgerald Brian | $108,000 | -- |
Source: Public Records
Mortgage History
We collect this data history from publicly available records. To have your information removed, we recommend requesting removal directly through your county’s website.
| Date | Status | Borrower | Loan Amount |
|---|---|---|---|
| Open | Lauzon Roland J | $55,000 | |
| Closed | Fitzgerald Brian | $55,000 | |
| Previous Owner | Wegiel Keith J | $306,000 |
Source: Public Records
Tax History
| Year | Tax Paid | Tax Assessment Tax Assessment Total Assessment is a certain percentage of the fair market value that is determined by local assessors to be the total taxable value of land and additions on the property. | Land | Improvement |
|---|---|---|---|---|
| 2025 | $5,156 | $297,200 | $89,500 | $207,700 |
| 2024 | $4,977 | $275,100 | $89,300 | $185,800 |
| 2023 | $5,004 | $256,500 | $81,800 | $174,700 |
| 2022 | $4,558 | $228,000 | $75,000 | $153,000 |
| 2021 | $4,576 | $217,100 | $75,000 | $142,100 |
| 2020 | $4,617 | $223,900 | $73,800 | $150,100 |
| 2019 | $4,331 | $218,500 | $73,100 | $145,400 |
| 2018 | $3,960 | $208,300 | $73,100 | $135,200 |
| 2017 | $3,845 | $207,500 | $71,700 | $135,800 |
| 2016 | $3,722 | $205,300 | $70,200 | $135,100 |
| 2015 | $3,522 | $203,700 | $69,500 | $134,200 |
Source: Public Records
Map
Nearby Homes
- 113 Skyridge St
- lot 14 West St
- 353 Fuller St Unit 45
- 95 Summer Ave
- 35 Focosi Ln
- 212 Blisswood Village Dr
- 39 Waters Edge Unit 39
- 110 Nora Ln
- 72 Chapin Greene Dr
- 84 Chapin Greene Dr
- 350 West Ave Unit 5
- 222-224 Main St
- 580 Fuller St
- 70 Sroka Ln
- 295 Main St
- 28 Mockingbird Dr
- 38 Lark Dr
- 46-48 Milton St
- 42 Berkshire St
- 0 Center St Unit 73415933
Your Personal Tour Guide
Ask me questions while you tour the home.