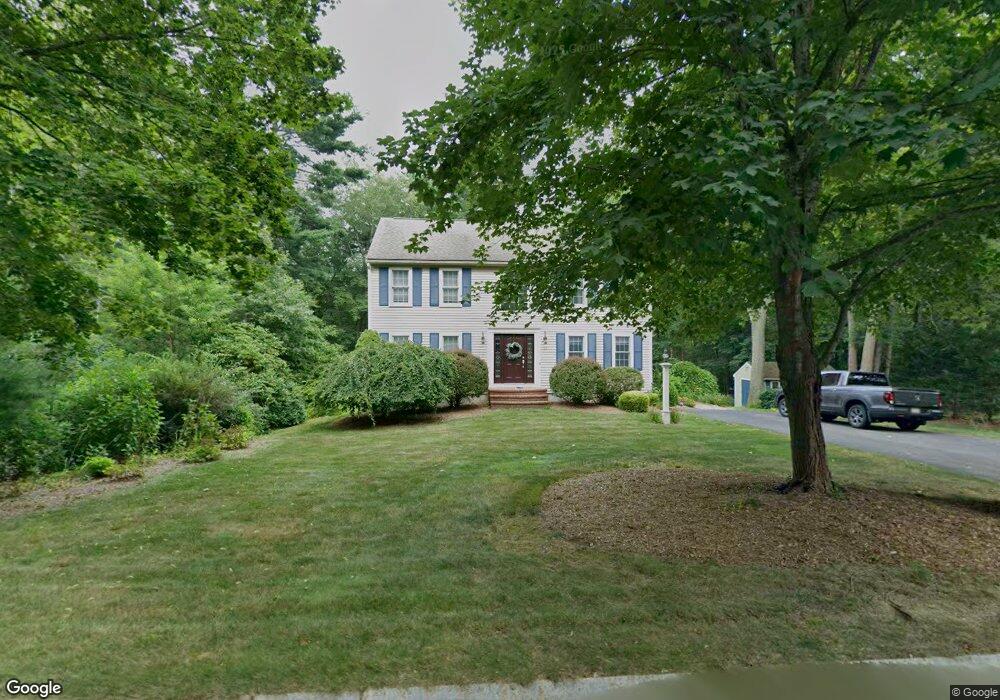
39 Smith Rd Mansfield, MA 02048
Estimated Value: $877,013 - $996,000
4
Beds
3
Baths
2,456
Sq Ft
$381/Sq Ft
Est. Value
About This Home
This home is located at 39 Smith Rd, Mansfield, MA 02048 and is currently estimated at $936,003, approximately $381 per square foot. 39 Smith Rd is a home located in Bristol County with nearby schools including Everett W. Robinson Elementary School, Jordan/Jackson Elementary School, and Harold L. Qualters Middle School.
Ownership History
Date
Name
Owned For
Owner Type
Purchase Details
Closed on
Aug 22, 1996
Sold by
Christian & Feck Dev
Bought by
Jenssen Richard G
Current Estimated Value
Home Financials for this Owner
Home Financials are based on the most recent Mortgage that was taken out on this home.
Original Mortgage
$197,750
Interest Rate
8.4%
Mortgage Type
Purchase Money Mortgage
Create a Home Valuation Report for This Property
The Home Valuation Report is an in-depth analysis detailing your home's value as well as a comparison with similar homes in the area
Home Values in the Area
Average Home Value in this Area
Purchase History
| Date | Buyer | Sale Price | Title Company |
|---|---|---|---|
| Jenssen Richard G | $219,745 | -- |
Source: Public Records
Mortgage History
| Date | Status | Borrower | Loan Amount |
|---|---|---|---|
| Open | Jenssen Richard G | $207,000 | |
| Closed | Jenssen Richard G | $196,000 | |
| Closed | Jenssen Richard G | $197,750 |
Source: Public Records
Tax History
| Year | Tax Paid | Tax Assessment Tax Assessment Total Assessment is a certain percentage of the fair market value that is determined by local assessors to be the total taxable value of land and additions on the property. | Land | Improvement |
|---|---|---|---|---|
| 2025 | $9,540 | $724,400 | $278,100 | $446,300 |
| 2024 | $9,373 | $694,300 | $290,200 | $404,100 |
| 2023 | $9,097 | $645,600 | $290,200 | $355,400 |
| 2022 | $8,736 | $575,900 | $268,600 | $307,300 |
| 2021 | $10,233 | $544,200 | $223,900 | $320,300 |
| 2020 | $3,752 | $536,000 | $223,900 | $312,100 |
| 2019 | $7,732 | $508,000 | $186,500 | $321,500 |
| 2018 | $3,381 | $493,700 | $177,800 | $315,900 |
| 2017 | $7,216 | $480,400 | $172,800 | $307,600 |
| 2016 | $6,933 | $449,900 | $164,500 | $285,400 |
| 2015 | $6,758 | $436,000 | $164,500 | $271,500 |
Source: Public Records
Map
Nearby Homes
- 128 Tremont St
- 1769 West St
- 17 Childs Ln
- 24 Maverick Dr
- 25 Shepherd St
- 14 Claire Ave
- 150 Gilbert St
- 401 South St
- 346 South St
- 166 Chauncy St
- 40 Treasure Island Rd
- 16 Treasure Island Rd
- 356 Central St
- 9 Coach Rd
- 84 Messenger St
- 33 Colonial Way
- 2 Oak St Unit 2B
- 28 Court St
- 44 Fairfield Park Unit 44
- 25 Munroe Dr
Your Personal Tour Guide
Ask me questions while you tour the home.