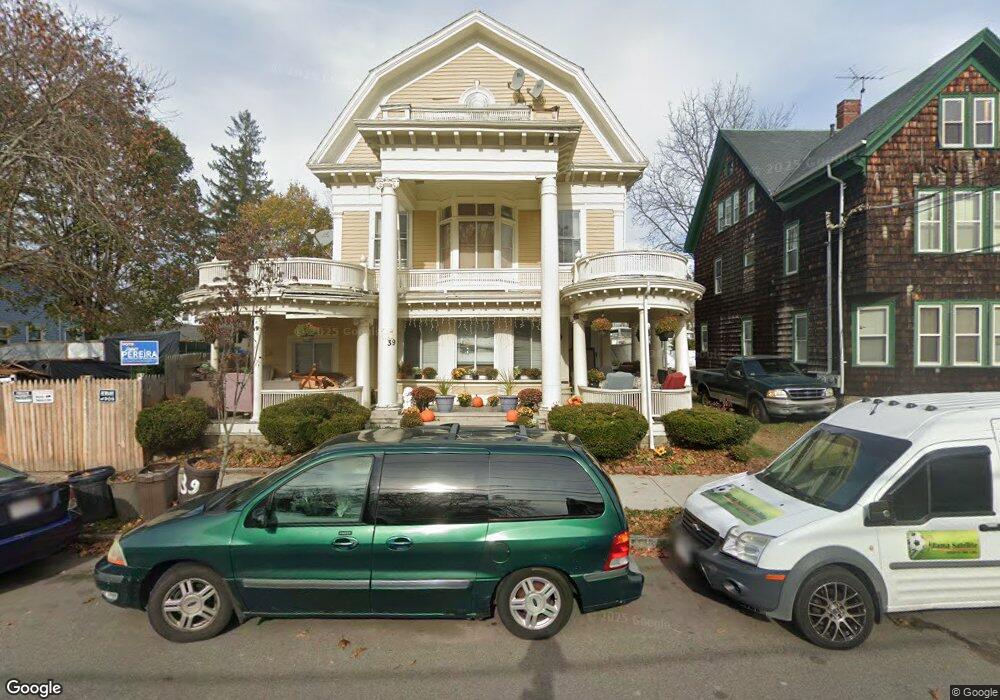
39 South St Brockton, MA 02301
Clifton Heights NeighborhoodEstimated Value: $494,303 - $633,000
6
Beds
1
Bath
3,681
Sq Ft
$153/Sq Ft
Est. Value
About This Home
This home is located at 39 South St, Brockton, MA 02301 and is currently estimated at $563,652, approximately $153 per square foot. 39 South St is a home located in Plymouth County with nearby schools including Gilmore Elementary School, Davis K-8 School, and John F. Kennedy Elementary School.
Ownership History
Date
Name
Owned For
Owner Type
Purchase Details
Closed on
Mar 27, 2025
Sold by
Xavier Jonathan G and Emm Loans Llc
Bought by
Dreams To Realty Llc
Current Estimated Value
Home Financials for this Owner
Home Financials are based on the most recent Mortgage that was taken out on this home.
Original Mortgage
$200,000
Outstanding Balance
$198,976
Interest Rate
6.87%
Mortgage Type
Commercial
Estimated Equity
$364,676
Purchase Details
Closed on
Dec 15, 2023
Sold by
Holders Of The Assets Loa and Us Bank Na Tr
Bought by
Xavier Jonathan G
Purchase Details
Closed on
Dec 3, 2020
Sold by
Bmr South Street Llc
Bought by
Xavier Jonathan G
Home Financials for this Owner
Home Financials are based on the most recent Mortgage that was taken out on this home.
Original Mortgage
$364,125
Interest Rate
2.7%
Mortgage Type
New Conventional
Purchase Details
Closed on
Sep 26, 2019
Sold by
Rogers Maria
Bought by
Bmr South Street Llc
Home Financials for this Owner
Home Financials are based on the most recent Mortgage that was taken out on this home.
Original Mortgage
$335,000
Interest Rate
3.5%
Mortgage Type
New Conventional
Purchase Details
Closed on
Jul 24, 2018
Sold by
Bmr South Street Llc
Bought by
Roger Maria
Purchase Details
Closed on
Jun 21, 2016
Sold by
39 South Street Rt and Neponset Inv Rt Llc Tr
Bought by
Bmr South Street Llc
Home Financials for this Owner
Home Financials are based on the most recent Mortgage that was taken out on this home.
Original Mortgage
$235,000
Interest Rate
3.61%
Mortgage Type
Commercial
Purchase Details
Closed on
Apr 3, 2013
Sold by
39 South Street Rt and Neponset Investments L
Bought by
39 South Street Rt and Neponset Invest Re Llc
Purchase Details
Closed on
Jul 27, 2012
Sold by
Home Equity Loan T and Us Bank Na
Bought by
South Street Rt
Purchase Details
Closed on
Feb 15, 2012
Sold by
Boyer Sophia and Us Bank Na
Bought by
Us Bank Na Tr
Purchase Details
Closed on
Jan 4, 2002
Sold by
Sears Gerald M and Mize Michael
Bought by
Boyer Sophia and Armand Gerard
Purchase Details
Closed on
Dec 4, 1995
Sold by
Fdic and Guaranty First Trust
Bought by
Sears Gerald M
Purchase Details
Closed on
Oct 31, 1991
Sold by
Richard Buccheri Jr Rt
Bought by
Guaranty First Tr Co
Purchase Details
Closed on
May 23, 1988
Sold by
C & B Ft
Bought by
R J Buccheri Jr Rt
Create a Home Valuation Report for This Property
The Home Valuation Report is an in-depth analysis detailing your home's value as well as a comparison with similar homes in the area
Home Values in the Area
Average Home Value in this Area
Purchase History
| Date | Buyer | Sale Price | Title Company |
|---|---|---|---|
| Dreams To Realty Llc | $250,000 | None Available | |
| Dreams To Realty Llc | $250,000 | None Available | |
| Xavier Jonathan G | -- | None Available | |
| Xavier Jonathan G | -- | None Available | |
| Xavier Jonathan G | -- | None Available | |
| Xavier Jonathan G | -- | None Available | |
| Bmr South Street Llc | -- | -- | |
| Roger Maria | -- | -- | |
| Roger Maria | -- | -- | |
| Bmr South Street Llc | $255,000 | -- | |
| Bmr South Street Llc | $255,000 | -- | |
| 39 South Street Rt | -- | -- | |
| 39 South Street Rt | -- | -- | |
| 39 South Street Rt | -- | -- | |
| South Street Rt | $150,000 | -- | |
| South Street Rt | $150,000 | -- | |
| Us Bank Na Tr | $152,193 | -- | |
| Us Bank Na Tr | $152,193 | -- | |
| Boyer Sophia | $270,000 | -- | |
| Boyer Sophia | $270,000 | -- | |
| Sears Gerald M | $35,000 | -- | |
| Sears Gerald M | $35,000 | -- | |
| Guaranty First Tr Co | $140,000 | -- | |
| R J Buccheri Jr Rt | $260,000 | -- |
Source: Public Records
Mortgage History
| Date | Status | Borrower | Loan Amount |
|---|---|---|---|
| Open | Dreams To Realty Llc | $200,000 | |
| Closed | Dreams To Realty Llc | $200,000 | |
| Previous Owner | Xavier Jonathan G | $364,125 | |
| Previous Owner | Bmr South Street Llc | $335,000 | |
| Previous Owner | Bmr South Street Llc | $235,000 | |
| Previous Owner | R J Buccheri Jr Rt | $263,100 |
Source: Public Records
Tax History Compared to Growth
Tax History
| Year | Tax Paid | Tax Assessment Tax Assessment Total Assessment is a certain percentage of the fair market value that is determined by local assessors to be the total taxable value of land and additions on the property. | Land | Improvement |
|---|---|---|---|---|
| 2025 | $1,757 | $145,100 | $140,500 | $4,600 |
| 2024 | $1,744 | $145,100 | $140,500 | $4,600 |
| 2023 | $8,641 | $665,700 | $106,200 | $559,500 |
| 2022 | $8,308 | $594,700 | $96,600 | $498,100 |
| 2021 | $7,385 | $509,300 | $80,600 | $428,700 |
| 2020 | $6,951 | $458,800 | $75,100 | $383,700 |
| 2019 | $6,653 | $428,100 | $73,200 | $354,900 |
| 2018 | $6,706 | $374,900 | $73,200 | $301,700 |
| 2017 | $6,071 | $377,100 | $73,200 | $303,900 |
| 2016 | $5,432 | $312,900 | $71,000 | $241,900 |
| 2015 | $4,438 | $244,500 | $71,000 | $173,500 |
| 2014 | $4,366 | $240,800 | $71,000 | $169,800 |
Source: Public Records
Map
Nearby Homes
- 33 South St
- 47 South St
- 46 W Chestnut St
- 40 W Chestnut St
- 34 W Chestnut St
- 42 South St
- 48 W Chestnut St
- 48 W Chestnut St Unit 2
- 48 W Chestnut St Unit 1
- 34 South St
- 34 South St Unit 1
- 27 South St
- 50 South St
- 36 South St
- 57 South St
- 30 W Chestnut St
- 56 W Chestnut St
- 30 South St
- 30 South St Unit 1R
- 26 W Chestnut St