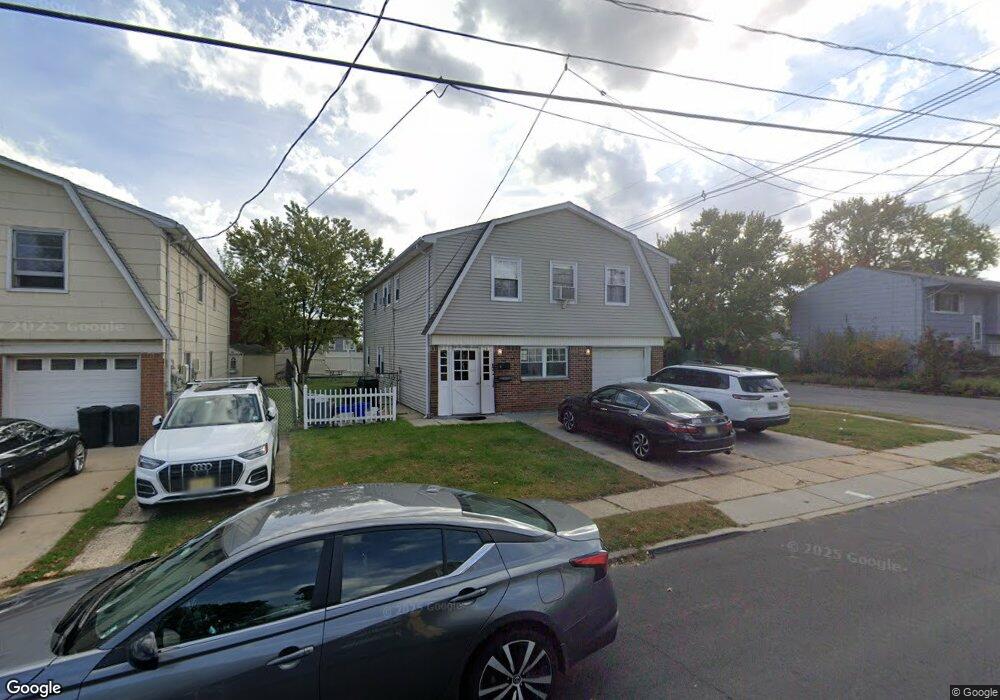
39 Spruce St Unit 1 Carteret, NJ 07008
Estimated Value: $565,000 - $629,000
2
Beds
1
Bath
2,364
Sq Ft
$254/Sq Ft
Est. Value
About This Home
This home is located at 39 Spruce St Unit 1, Carteret, NJ 07008 and is currently estimated at $600,990, approximately $254 per square foot. 39 Spruce St Unit 1 is a home located in Middlesex County with nearby schools including Carteret High School and St Joseph School.
Ownership History
Date
Name
Owned For
Owner Type
Purchase Details
Closed on
Apr 12, 2017
Sold by
Chatha Muhammad A and Jabeen Asia
Bought by
Cloty Investments Llc
Current Estimated Value
Purchase Details
Closed on
Jan 31, 2005
Sold by
Lazzaro Thomas
Bought by
Chatha Muhammad
Home Financials for this Owner
Home Financials are based on the most recent Mortgage that was taken out on this home.
Original Mortgage
$79,310
Interest Rate
5.24%
Mortgage Type
Stand Alone Second
Create a Home Valuation Report for This Property
The Home Valuation Report is an in-depth analysis detailing your home's value as well as a comparison with similar homes in the area
Home Values in the Area
Average Home Value in this Area
Purchase History
| Date | Buyer | Sale Price | Title Company |
|---|---|---|---|
| Cloty Investments Llc | $275,000 | None Available | |
| Chatha Muhammad | $396,550 | -- | |
| -- | $396,600 | -- |
Source: Public Records
Mortgage History
| Date | Status | Borrower | Loan Amount |
|---|---|---|---|
| Previous Owner | -- | $79,310 | |
| Previous Owner | -- | $317,240 |
Source: Public Records
Tax History Compared to Growth
Tax History
| Year | Tax Paid | Tax Assessment Tax Assessment Total Assessment is a certain percentage of the fair market value that is determined by local assessors to be the total taxable value of land and additions on the property. | Land | Improvement |
|---|---|---|---|---|
| 2025 | $8,748 | $587,500 | $282,500 | $305,000 |
| 2024 | $8,523 | $274,400 | $85,000 | $189,400 |
| 2023 | $8,523 | $274,400 | $85,000 | $189,400 |
| 2022 | $8,287 | $274,400 | $85,000 | $189,400 |
| 2021 | $6,072 | $274,400 | $85,000 | $189,400 |
| 2020 | $7,892 | $274,400 | $85,000 | $189,400 |
| 2019 | $7,664 | $274,400 | $85,000 | $189,400 |
| 2018 | $7,483 | $274,400 | $85,000 | $189,400 |
| 2017 | $7,217 | $274,400 | $85,000 | $189,400 |
| 2016 | $7,956 | $251,200 | $80,000 | $171,200 |
| 2015 | $7,840 | $251,200 | $80,000 | $171,200 |
| 2014 | $7,498 | $251,200 | $80,000 | $171,200 |
Source: Public Records
Map
Nearby Homes