
Seller's Agent in 2025
Debbi DiMaggio Betta
Corcoran Icon Properties
(510) 414-6777
7 in this area
62 Total Sales
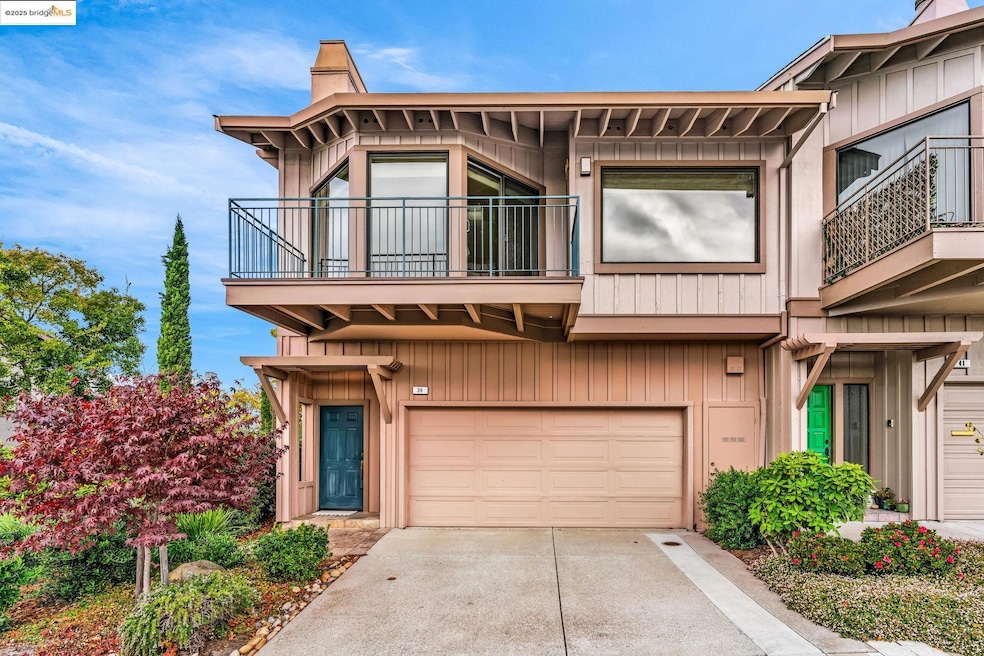
Welcome to 39 Starview Drive, a spacious 3-bedroom, 3-bathroom end-unit townhome in the highly sought-after Hiller Highlands community, celebrated for its stunning San Francisco Bay and Downtown Oakland views. With nearly 2,000 square feet of living space, this home offers incredible potential and a rare opportunity to customize your dream retreat in one of the East Bay’s most desirable neighborhoods. The main level features a large living and dining area with soaring ceilings, a cozy fireplace, and expansive windows that frame sweeping views of the Bay, bridges, and city skyline. Step out onto the private deck to take in the beauty of San Francisco sunsets or enjoy your morning coffee surrounded by natural light and tranquility. The functional floor plan includes a full bathroom and flexible bedroom or office on the first level—perfect for guests or remote work. Upstairs, the spacious primary suite looks over the main living area, ideal for relaxing or entertaining. The two-car garage with interior access adds convenience and generous storage. Enjoy access to the best of the East Bay from this peaceful hillside setting—minutes from Rockridge, College Avenue, Montclair Village, Orinda, Lafayette, and major freeways for easy commuting.
Last Agent to Sell the Property
Corcoran Icon Properties License #01047447 Listed on: 11/12/2025
| Date | Type | Sale Price | Title Company |
|---|---|---|---|
| Grant Deed | $1,075,000 | Chicago Title | |
| Interfamily Deed Transfer | -- | None Available | |
| Interfamily Deed Transfer | -- | None Available | |
| Interfamily Deed Transfer | -- | None Available | |
| Interfamily Deed Transfer | -- | Regional Lender Center | |
| Interfamily Deed Transfer | -- | Accommodation | |
| Interfamily Deed Transfer | -- | First American Title Company | |
| Interfamily Deed Transfer | -- | None Available | |
| Interfamily Deed Transfer | -- | None Available |
| Date | Status | Loan Amount | Loan Type |
|---|---|---|---|
| Open | $750,000 | New Conventional | |
| Previous Owner | $257,000 | New Conventional | |
| Previous Owner | $271,000 | New Conventional |
| Date | Event | Price | List to Sale | Price per Sq Ft |
|---|---|---|---|---|
| 12/30/2025 12/30/25 | Sold | $1,075,000 | -6.5% | $553 / Sq Ft |
| 12/02/2025 12/02/25 | Pending | -- | -- | -- |
| 11/12/2025 11/12/25 | For Sale | $1,150,000 | -- | $591 / Sq Ft |
| Year | Tax Paid | Tax Assessment Tax Assessment Total Assessment is a certain percentage of the fair market value that is determined by local assessors to be the total taxable value of land and additions on the property. | Land | Improvement |
|---|---|---|---|---|
| 2025 | $4,693 | $252,119 | $77,691 | $181,428 |
| 2024 | $4,693 | $247,039 | $76,168 | $177,871 |
| 2023 | $4,850 | $249,059 | $74,675 | $174,384 |
| 2022 | $4,665 | $237,176 | $73,211 | $170,965 |
| 2021 | $4,340 | $232,389 | $71,775 | $167,614 |
| 2020 | $4,288 | $236,935 | $71,040 | $165,895 |
| 2019 | $4,048 | $232,290 | $69,647 | $162,643 |
| 2018 | $3,960 | $227,735 | $68,281 | $159,454 |
| 2017 | $3,772 | $223,270 | $66,942 | $156,328 |
| 2016 | $3,693 | $218,893 | $65,630 | $153,263 |
| 2015 | $3,789 | $215,606 | $64,644 | $150,962 |
| 2014 | $3,755 | $211,383 | $63,378 | $148,005 |
Seller's Agent in 2025
Debbi DiMaggio Betta
Corcoran Icon Properties
(510) 414-6777
7 in this area
62 Total Sales
Seller Co-Listing Agent in 2025
Adam Betta
Corcoran Icon Properties
(510) 414-1250
8 in this area
50 Total Sales
s
Buyer's Agent in 2025
saiid Kahangi
Abacus Realty
(925) 768-3969
1 in this area
2 Total Sales
Source: bridgeMLS
MLS Number: 41117272
APN: 048H-7590-081-00
Disclaimer: Certain information contained herein is derived from information provided by parties other than Homes.com. All information provided is deemed reliable, but is not guaranteed to be accurate and should be independently verified.
![]() Bay East 2026. CCAR 2026. bridgeMLS 2026. Information Deemed Reliable But Not Guaranteed. This information is being provided by the Bay East MLS, or CCAR MLS, or bridgeMLS. The listings presented here may or may not be listed by the Broker/Agent operating this website. This information is intended for the personal use of consumers and may not be used for any purpose other than to identify prospective properties consumers may be interested in purchasing.
Bay East 2026. CCAR 2026. bridgeMLS 2026. Information Deemed Reliable But Not Guaranteed. This information is being provided by the Bay East MLS, or CCAR MLS, or bridgeMLS. The listings presented here may or may not be listed by the Broker/Agent operating this website. This information is intended for the personal use of consumers and may not be used for any purpose other than to identify prospective properties consumers may be interested in purchasing.
Ask me questions while you tour the home.