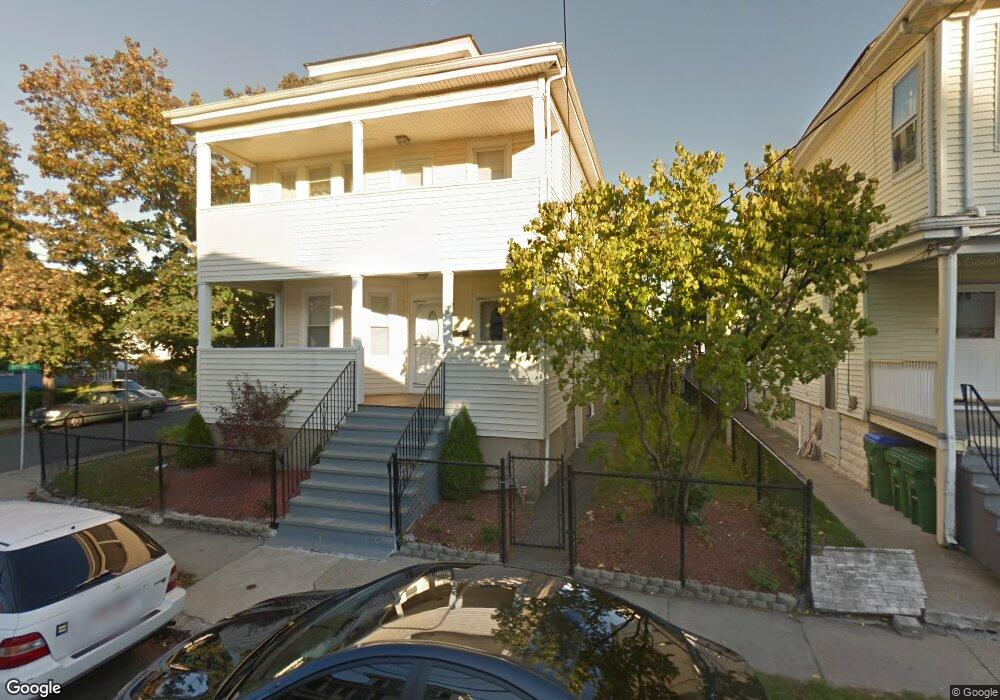
39 Sydney St Medford, MA 02155
Wellington NeighborhoodEstimated Value: $1,108,000 - $1,311,000
5
Beds
2
Baths
2,194
Sq Ft
$551/Sq Ft
Est. Value
About This Home
This home is located at 39 Sydney St, Medford, MA 02155 and is currently estimated at $1,209,426, approximately $551 per square foot. 39 Sydney St is a home located in Middlesex County with nearby schools including Medford High School, Mystic Valley Regional Charter School, and St. Joseph School.
Ownership History
Date
Name
Owned For
Owner Type
Purchase Details
Closed on
May 27, 2021
Sold by
Terranova Realty Llc
Bought by
Terranova Lina M
Current Estimated Value
Home Financials for this Owner
Home Financials are based on the most recent Mortgage that was taken out on this home.
Original Mortgage
$600,000
Outstanding Balance
$541,727
Interest Rate
3%
Mortgage Type
New Conventional
Estimated Equity
$667,699
Purchase Details
Closed on
May 20, 2021
Sold by
Terranova Realty Llc
Bought by
Terranova Lina
Home Financials for this Owner
Home Financials are based on the most recent Mortgage that was taken out on this home.
Original Mortgage
$600,000
Outstanding Balance
$541,727
Interest Rate
3%
Mortgage Type
New Conventional
Estimated Equity
$667,699
Purchase Details
Closed on
Jun 23, 2009
Sold by
Terranova Christina M and Terranova Joseph E
Bought by
Terranova Realty Llc
Purchase Details
Closed on
Mar 31, 2008
Sold by
Malvone Leonard A and Malvone Rosemary E
Bought by
Terranova Christina M and Terranova Joseph E
Home Financials for this Owner
Home Financials are based on the most recent Mortgage that was taken out on this home.
Original Mortgage
$300,000
Interest Rate
5.76%
Mortgage Type
Purchase Money Mortgage
Purchase Details
Closed on
Feb 23, 2005
Sold by
Malvone Leonard A and Malvone Rosemary
Bought by
Malvone Leonard A
Purchase Details
Closed on
Apr 7, 2004
Sold by
Malvone Rosemary
Bought by
Malvone Leonard A and Malvone Rosemary
Purchase Details
Closed on
Sep 13, 2003
Sold by
Salerno Rt and Malvone
Bought by
Malvone Rosemary
Create a Home Valuation Report for This Property
The Home Valuation Report is an in-depth analysis detailing your home's value as well as a comparison with similar homes in the area
Home Values in the Area
Average Home Value in this Area
Purchase History
| Date | Buyer | Sale Price | Title Company |
|---|---|---|---|
| Terranova Lina M | -- | None Available | |
| Terranova Lina M | -- | None Available | |
| Terranova Lina | -- | None Available | |
| Terranova Lina | -- | None Available | |
| Terranova Realty Llc | -- | -- | |
| Terranova Realty Llc | -- | -- | |
| Terranova Realty Llc | -- | -- | |
| Terranova Christina M | $377,000 | -- | |
| Terranova Christina M | $377,000 | -- | |
| Terranova Christina M | $377,000 | -- | |
| Malvone Leonard A | -- | -- | |
| Malvone Leonard A | -- | -- | |
| Malvone Leonard A | -- | -- | |
| Malvone Leonard A | -- | -- | |
| Malvone Leonard A | -- | -- | |
| Malvone Leonard A | -- | -- | |
| Malvone Rosemary | -- | -- | |
| Malvone Rosemary | -- | -- |
Source: Public Records
Mortgage History
| Date | Status | Borrower | Loan Amount |
|---|---|---|---|
| Open | Terranova Lina M | $600,000 | |
| Closed | Terranova Lina M | $600,000 | |
| Previous Owner | Terranova Christina M | $300,000 |
Source: Public Records
Tax History Compared to Growth
Tax History
| Year | Tax Paid | Tax Assessment Tax Assessment Total Assessment is a certain percentage of the fair market value that is determined by local assessors to be the total taxable value of land and additions on the property. | Land | Improvement |
|---|---|---|---|---|
| 2025 | $9,926 | $1,128,000 | $322,600 | $805,400 |
| 2024 | $9,127 | $1,071,200 | $307,200 | $764,000 |
| 2023 | $8,968 | $1,036,800 | $287,100 | $749,700 |
| 2022 | $9,106 | $1,010,700 | $261,000 | $749,700 |
| 2021 | $8,519 | $905,300 | $248,600 | $656,700 |
| 2020 | $6,372 | $694,100 | $246,000 | $448,100 |
| 2019 | $5,910 | $615,600 | $211,800 | $403,800 |
| 2018 | $5,620 | $548,800 | $192,600 | $356,200 |
| 2017 | $5,270 | $499,100 | $180,000 | $319,100 |
| 2016 | $5,145 | $459,800 | $163,600 | $296,200 |
| 2015 | $4,856 | $415,000 | $155,900 | $259,100 |
Source: Public Records
Map
Nearby Homes
- 830 Fellsway
- 82 2nd St
- 42 Gibson St
- 320 Middlesex Ave Unit A207
- 320 Middlesex Ave Unit E403
- 320 Middlesex Ave Unit A406
- 320 Middlesex Ave Unit A208
- 57 1st St Unit 2
- 55 Evans St
- 8 Ninth St Unit 303
- 8 9th St Unit 406
- 8 9th St Unit 513
- 216 Central Ave Unit 218
- 3920 Mystic Valley Pkwy Unit 217W
- 3920 Mystic Valley Pkwy Unit 1119W
- 3920 Mystic Valley Pkwy Unit 620
- 3920 Mystic Valley Pkwy Unit 817
- 3920 Mystic Valley Pkwy Unit 303
- 3920 Mystic Valley Pkwy Unit 115
- 305 Riverside Ave Unit 41
- 39 Sydney St Unit 39
- 39 Sydney St Unit 41
- 37 Sydney St
- 37 Sydney St Unit 2
- 35 Sydney St
- 35 Sydney St Unit 2
- 848 Fellsway
- 848 Fellsway Unit 1
- 848 Fellsway Unit 2
- 848 Fellsway
- 848 Fellsway Unit B
- 848 Fellsway Unit 3
- 850 Fellsway
- 51 Sydney St
- 846 Fellsway
- 846 Fellsway Unit 2
- 848/850 Fellsway Unit 1
- 840 Fellsway Unit 2
- 842 Fellsway
- 840 Fellsway Unit 840