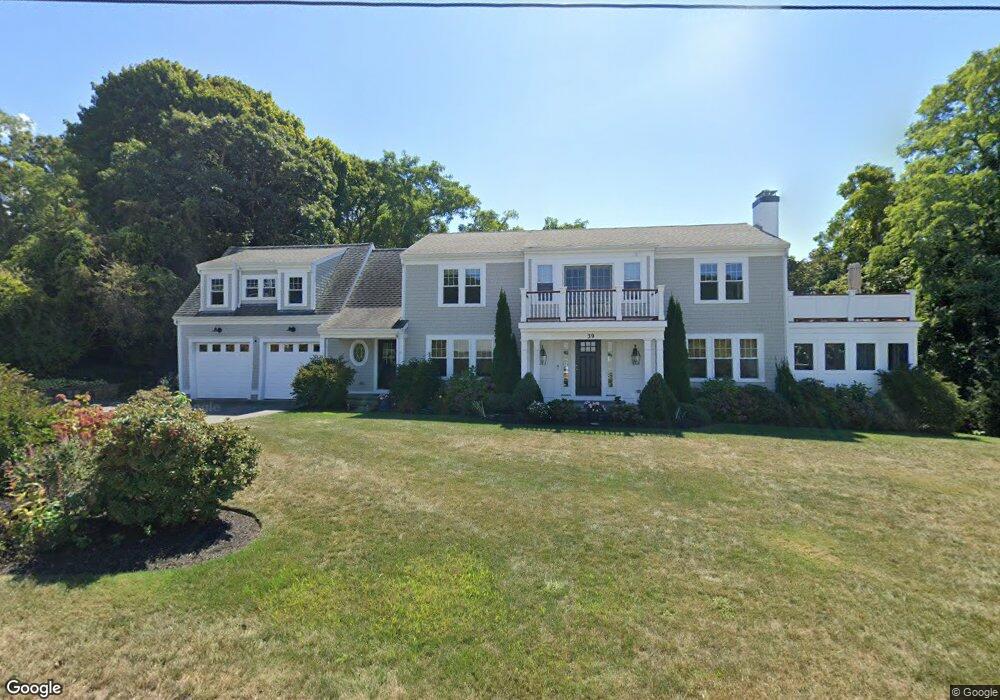
39 View Crest Dr Falmouth, MA 02540
Estimated Value: $1,569,000 - $2,032,000
3
Beds
4
Baths
3,347
Sq Ft
$544/Sq Ft
Est. Value
About This Home
This home is located at 39 View Crest Dr, Falmouth, MA 02540 and is currently estimated at $1,821,585, approximately $544 per square foot. 39 View Crest Dr is a home located in Barnstable County with nearby schools including Mullen-Hall School, Morse Pond School, and Lawrence School.
Ownership History
Date
Name
Owned For
Owner Type
Purchase Details
Closed on
Jun 5, 1992
Sold by
Nickerson Natalie M
Bought by
Cote Stephen F and Cote Mary K
Current Estimated Value
Home Financials for this Owner
Home Financials are based on the most recent Mortgage that was taken out on this home.
Original Mortgage
$131,200
Interest Rate
8.8%
Mortgage Type
Purchase Money Mortgage
Create a Home Valuation Report for This Property
The Home Valuation Report is an in-depth analysis detailing your home's value as well as a comparison with similar homes in the area
Home Values in the Area
Average Home Value in this Area
Purchase History
| Date | Buyer | Sale Price | Title Company |
|---|---|---|---|
| Cote Stephen F | $164,000 | -- | |
| Cote Stephen F | $164,000 | -- |
Source: Public Records
Mortgage History
| Date | Status | Borrower | Loan Amount |
|---|---|---|---|
| Closed | Cote Stephen F | $131,200 |
Source: Public Records
Tax History Compared to Growth
Tax History
| Year | Tax Paid | Tax Assessment Tax Assessment Total Assessment is a certain percentage of the fair market value that is determined by local assessors to be the total taxable value of land and additions on the property. | Land | Improvement |
|---|---|---|---|---|
| 2025 | $9,027 | $1,537,900 | $429,700 | $1,108,200 |
| 2024 | $8,800 | $1,401,300 | $390,600 | $1,010,700 |
| 2023 | $7,500 | $1,083,800 | $312,500 | $771,300 |
| 2022 | $7,307 | $907,700 | $258,800 | $648,900 |
| 2021 | $6,865 | $807,700 | $247,500 | $560,200 |
| 2020 | $6,745 | $785,200 | $225,000 | $560,200 |
| 2019 | $6,681 | $780,500 | $225,000 | $555,500 |
| 2018 | $6,559 | $762,700 | $225,000 | $537,700 |
| 2017 | $6,305 | $739,100 | $225,000 | $514,100 |
| 2016 | $6,186 | $739,100 | $225,000 | $514,100 |
| 2015 | $6,053 | $739,100 | $225,000 | $514,100 |
| 2014 | $5,636 | $691,500 | $225,100 | $466,400 |
Source: Public Records
Map
Nearby Homes