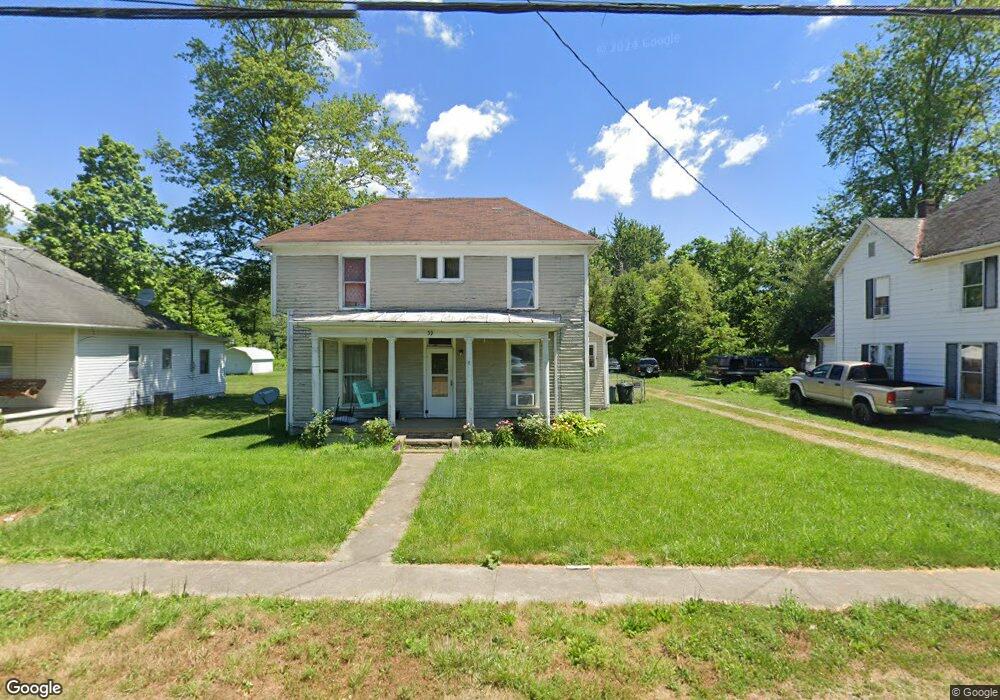
39 W Main St Sardinia, OH 45171
Estimated Value: $60,080 - $164,000
2
Beds
1
Bath
1,500
Sq Ft
$77/Sq Ft
Est. Value
About This Home
This home is located at 39 W Main St, Sardinia, OH 45171 and is currently estimated at $114,770, approximately $76 per square foot. 39 W Main St is a home located in Highland County with nearby schools including Bright Elementary School, Whiteoak Junior High School, and Whiteoak High School.
Ownership History
Date
Name
Owned For
Owner Type
Purchase Details
Closed on
Nov 13, 2017
Sold by
Castle Cfd Group Llc
Bought by
Carter Jerry
Current Estimated Value
Purchase Details
Closed on
Nov 9, 2017
Sold by
Cr Capital Group Llc
Bought by
Castle Cfd Group Llc
Purchase Details
Closed on
Mar 30, 2015
Sold by
Cr Capital Group Llc
Bought by
Castle Cfd Group Llc
Purchase Details
Closed on
May 21, 2013
Sold by
Deutsche Bank National Trust Company
Bought by
Cr Capital Group Llc
Purchase Details
Closed on
Feb 22, 2013
Sold by
Wilmoth Joshua E
Bought by
Deutsche Bank National Trust Company
Purchase Details
Closed on
Jan 2, 2013
Sold by
Wilmoth Joshua E
Bought by
Deutsche Bank National Trust Company
Purchase Details
Closed on
Aug 22, 2001
Sold by
St Clair Lisa G
Bought by
Wilmoth Joshua E
Home Financials for this Owner
Home Financials are based on the most recent Mortgage that was taken out on this home.
Original Mortgage
$58,000
Interest Rate
7.28%
Mortgage Type
New Conventional
Purchase Details
Closed on
Jan 1, 1990
Bought by
Crowe Lisa Gay
Create a Home Valuation Report for This Property
The Home Valuation Report is an in-depth analysis detailing your home's value as well as a comparison with similar homes in the area
Purchase History
| Date | Buyer | Sale Price | Title Company |
|---|---|---|---|
| Carter Jerry | $12,900 | None Available | |
| Castle Cfd Group Llc | -- | None Available | |
| Castle Cfd Group Llc | -- | None Available | |
| Cr Capital Group Llc | $9,400 | Title & Abstract Reo Inc | |
| Deutsche Bank National Trust Company | $24,000 | Attorney | |
| Deutsche Bank National Trust Company | $24,000 | None Available | |
| Wilmoth Joshua E | $54,000 | -- | |
| Crowe Lisa Gay | -- | -- |
Source: Public Records
Mortgage History
| Date | Status | Borrower | Loan Amount |
|---|---|---|---|
| Previous Owner | Wilmoth Joshua E | $58,000 |
Source: Public Records
Tax History
| Year | Tax Paid | Tax Assessment Tax Assessment Total Assessment is a certain percentage of the fair market value that is determined by local assessors to be the total taxable value of land and additions on the property. | Land | Improvement |
|---|---|---|---|---|
| 2024 | $453 | $13,690 | $2,380 | $11,310 |
| 2023 | $454 | $13,550 | $2,070 | $11,480 |
| 2022 | $551 | $13,550 | $2,070 | $11,480 |
| 2021 | $552 | $13,550 | $2,070 | $11,480 |
| 2020 | $523 | $12,320 | $1,890 | $10,430 |
| 2019 | $811 | $12,320 | $1,890 | $10,430 |
| 2018 | $989 | $12,320 | $1,890 | $10,430 |
| 2017 | $1,277 | $15,550 | $2,000 | $13,550 |
| 2016 | $2,096 | $15,550 | $2,000 | $13,550 |
| 2015 | $1,067 | $15,550 | $2,000 | $13,550 |
| 2014 | $777 | $14,810 | $1,890 | $12,920 |
| 2013 | $23 | $14,810 | $1,890 | $12,920 |
Source: Public Records
Map
Nearby Homes
- 25 W Diehl Ave
- 83 W Main St
- 838 Bells Run Rd
- 12754 5 Points Mowrystown Rd
- 9791 Stivers Rd
- 13178 Stieman Rd
- 1 Duncanson Rd
- 0 Horse Shoe Dr Unit 1857810
- 874 Waynoka Dr
- 2 Duncanson Rd
- 689 Duncanson Rd
- 0 Duncanson Rd Unit 24557375
- 0 Duncanson Rd Unit 24555971
- 7716 Tri County Hwy
- AC Tri County Hwy
- 175 Winchester St
- 134 Winchester St
- 20 W Mohican Cove
- 1656 S Waynoka
- 6 Mohican Cove
Your Personal Tour Guide
Ask me questions while you tour the home.