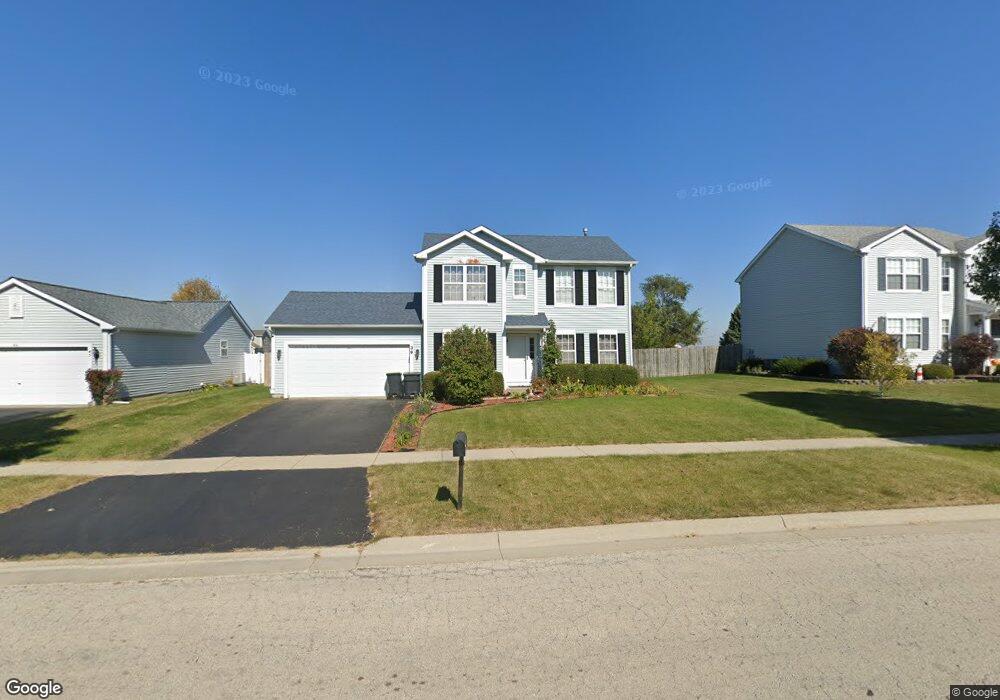
39 W Prairiefield Ave Cortland, IL 60112
Estimated Value: $299,000 - $305,000
3
Beds
7
Baths
1,422
Sq Ft
$212/Sq Ft
Est. Value
About This Home
This home is located at 39 W Prairiefield Ave, Cortland, IL 60112 and is currently estimated at $302,165, approximately $212 per square foot. 39 W Prairiefield Ave is a home located in DeKalb County with nearby schools including Sycamore High School, St Mary's Catholic School, and Cornerstone Christian Academy.
Ownership History
Date
Name
Owned For
Owner Type
Purchase Details
Closed on
May 30, 2018
Sold by
Melin Linda
Bought by
Ontjes Aaron and Ontjes Sheila P
Current Estimated Value
Home Financials for this Owner
Home Financials are based on the most recent Mortgage that was taken out on this home.
Original Mortgage
$170,000
Outstanding Balance
$100,412
Interest Rate
4%
Mortgage Type
VA
Estimated Equity
$201,753
Purchase Details
Closed on
Nov 27, 2017
Sold by
Argomaniz Carlos M
Bought by
Melin Linda
Purchase Details
Closed on
Jun 30, 2005
Sold by
Clark Deana K
Bought by
Argomaniz Carlos M
Home Financials for this Owner
Home Financials are based on the most recent Mortgage that was taken out on this home.
Original Mortgage
$166,250
Interest Rate
5.88%
Mortgage Type
New Conventional
Create a Home Valuation Report for This Property
The Home Valuation Report is an in-depth analysis detailing your home's value as well as a comparison with similar homes in the area
Home Values in the Area
Average Home Value in this Area
Purchase History
| Date | Buyer | Sale Price | Title Company |
|---|---|---|---|
| Ontjes Aaron | $170,000 | Attorney | |
| Melin Linda | $121,000 | First American Title | |
| Argomaniz Carlos M | $170,000 | -- |
Source: Public Records
Mortgage History
| Date | Status | Borrower | Loan Amount |
|---|---|---|---|
| Open | Ontjes Aaron | $170,000 | |
| Previous Owner | Argomaniz Carlos M | $166,250 |
Source: Public Records
Tax History Compared to Growth
Tax History
| Year | Tax Paid | Tax Assessment Tax Assessment Total Assessment is a certain percentage of the fair market value that is determined by local assessors to be the total taxable value of land and additions on the property. | Land | Improvement |
|---|---|---|---|---|
| 2024 | $5,247 | $81,088 | $16,315 | $64,773 |
| 2023 | $5,247 | $64,369 | $15,263 | $49,106 |
| 2022 | $5,169 | $61,433 | $14,567 | $46,866 |
| 2021 | $4,891 | $58,491 | $13,869 | $44,622 |
| 2020 | $4,708 | $55,918 | $13,436 | $42,482 |
| 2019 | $4,754 | $53,571 | $12,872 | $40,699 |
| 2018 | $5,164 | $50,663 | $12,173 | $38,490 |
| 2017 | $4,399 | $48,232 | $11,589 | $36,643 |
| 2016 | $4,232 | $45,331 | $10,892 | $34,439 |
| 2015 | -- | $51,517 | $10,228 | $41,289 |
| 2014 | -- | $49,583 | $9,844 | $39,739 |
| 2013 | -- | $51,381 | $10,201 | $41,180 |
Source: Public Records
Map
Nearby Homes
- 42 W Auburndale Ave
- 94 W Crabapple Ave
- Lot C7 Crabapple Ave
- Lot 2 Stonegate
- LOT E7 W Bluebell Ave
- Lot D7 Bluebell
- 20 W Sandalwood Ave
- 20 Sandalwood Ave
- 37 W Sandalwood Ave
- 437 N Charles St Unit 7
- 353 N Aspen Dr
- 347 N Aspen Dr
- 341 N Aspen Dr
- 335 N Aspen Dr
- 329 N Aspen Dr
- 300 N Aspen Dr
- 86 E Daisy Ave
- 189 E Lark Ave
- 95 Lots Chestnut Grove
- Lot B5 W Paw Ave
- 39 W Prairiefield Ave
- 35 W Prairiefield Ave
- 45 W Prairiefield Ave
- 59 W Prairiefield Ave
- 40 W Prairiefield Ave
- 46 W Prairiefield Ave
- 52 W Prairiefield Ave
- 65 W Prairiefield Ave
- 60 W Prairiefield Ave
- 71 W Prairiefield Ave
- 79 W Prairiefield Ave
- 4404 Prairiefield Dr
- 66 W Prairiefield Ave
- 72 W Prairiefield Ave
- 85 W Prairiefield Ave
- 64 W Pawpaw Ave
- 80 W Prairiefield Ave
- 86 W Prairiefield Ave
- 91 W Prairiefield Ave
- 67 W Auburndale Ave