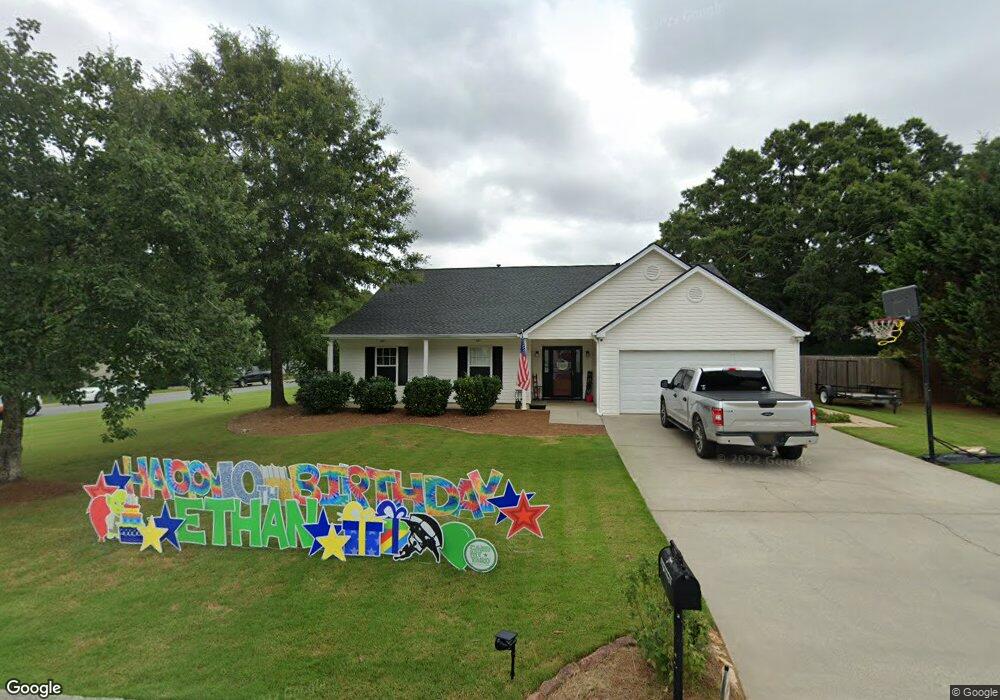
39 Walden Crossing NW Cartersville, GA 30120
Estimated Value: $331,000 - $384,000
4
Beds
2
Baths
2,168
Sq Ft
$161/Sq Ft
Est. Value
About This Home
This home is located at 39 Walden Crossing NW, Cartersville, GA 30120 and is currently estimated at $349,785, approximately $161 per square foot. 39 Walden Crossing NW is a home located in Bartow County with nearby schools including Hamilton Crossing Elementary School, Cass Middle School, and Cass High School.
Ownership History
Date
Name
Owned For
Owner Type
Purchase Details
Closed on
Mar 7, 2022
Sold by
Pealor Heather F
Bought by
Pealor Heather F and Pealor Christopher J
Current Estimated Value
Home Financials for this Owner
Home Financials are based on the most recent Mortgage that was taken out on this home.
Original Mortgage
$230,362
Outstanding Balance
$214,841
Interest Rate
3.76%
Mortgage Type
FHA
Estimated Equity
$134,944
Purchase Details
Closed on
Nov 10, 2009
Sold by
Us Bank National Associati
Bought by
Pealor Heather F
Home Financials for this Owner
Home Financials are based on the most recent Mortgage that was taken out on this home.
Original Mortgage
$120,772
Interest Rate
4.94%
Mortgage Type
FHA
Purchase Details
Closed on
Aug 4, 2009
Sold by
Bish David D
Bought by
Us Bank National Association
Purchase Details
Closed on
Apr 29, 2005
Sold by
Neuhaus Henry W
Bought by
Bish David D
Home Financials for this Owner
Home Financials are based on the most recent Mortgage that was taken out on this home.
Original Mortgage
$118,500
Interest Rate
7.63%
Mortgage Type
New Conventional
Create a Home Valuation Report for This Property
The Home Valuation Report is an in-depth analysis detailing your home's value as well as a comparison with similar homes in the area
Home Values in the Area
Average Home Value in this Area
Purchase History
| Date | Buyer | Sale Price | Title Company |
|---|---|---|---|
| Pealor Heather F | -- | -- | |
| Pealor Heather F | $123,000 | -- | |
| Us Bank National Association | $108,375 | -- | |
| Bish David D | $148,150 | -- |
Source: Public Records
Mortgage History
| Date | Status | Borrower | Loan Amount |
|---|---|---|---|
| Open | Pealor Heather F | $230,362 | |
| Previous Owner | Us Bank National Association | $120,772 | |
| Previous Owner | Bish David D | $118,500 | |
| Previous Owner | Bish David D | $29,650 |
Source: Public Records
Tax History Compared to Growth
Tax History
| Year | Tax Paid | Tax Assessment Tax Assessment Total Assessment is a certain percentage of the fair market value that is determined by local assessors to be the total taxable value of land and additions on the property. | Land | Improvement |
|---|---|---|---|---|
| 2024 | $3,178 | $130,766 | $25,200 | $105,566 |
| 2023 | $3,178 | $120,443 | $25,200 | $95,243 |
| 2022 | $2,605 | $102,585 | $16,000 | $86,585 |
| 2021 | $2,110 | $79,092 | $16,000 | $63,092 |
| 2020 | $2,063 | $75,092 | $12,000 | $63,092 |
| 2019 | $1,833 | $66,016 | $8,000 | $58,016 |
| 2018 | $1,814 | $65,104 | $8,000 | $57,104 |
| 2017 | $1,540 | $55,000 | $8,000 | $47,000 |
| 2016 | $1,552 | $55,000 | $8,000 | $47,000 |
| 2015 | $1,525 | $53,960 | $8,000 | $45,960 |
| 2014 | $1,237 | $42,400 | $8,000 | $34,400 |
| 2013 | -- | $40,640 | $8,000 | $32,640 |
Source: Public Records
Map
Nearby Homes
- 58 Hamil Ct NW
- 48 Hamilton Blvd NW
- 41 Hamilton Blvd NW
- 300 San Vito Way
- 317 Lucyanna Ln
- 653 Summerfield Ln NW
- The Caldwell Plan at Duncan Farm
- 1317 Cassville Rd NW
- 55 Irwin St NW
- 218 San Marino Way NW
- 548 Summerfield Ln NW
- 300 Pescara Ct NW
- 181 Kingston Highway 293 NW
- 19 Sweet Gracie Hollow NW
- 50 Jones St NW
- 50 Jones St
- 129 Chastain Dr SW
- 39 Bell Dr NW
- 1422 Cassville Rd NW
- 37 Glenabbey Dr NW
- 41 Walden Crossing NW
- 40 Glenabbey Dr NW
- 38 Glenabbey Dr NW
- 40 Walden Crossing NW
- 42 Glenabbey Dr NW
- 42 Walden Crossing NW
- 42 Walden Crossing NW Unit 1
- 35 Glenabbey Dr NW
- 15 Turnberry Ct NW
- 43 Walden Crossing NW
- 44 Glenabbey Dr NW
- 44 Walden Crossing NW
- 0 Walden Crossing Unit 8368071
- 0 Walden Crossing Unit 8229126
- 0 Walden Crossing Unit 7312188
- 0 Walden Crossing
- 33 Glenabbey Dr NW
- 13 Turnberry Ct NW
- 34 Glenabbey Dr NW