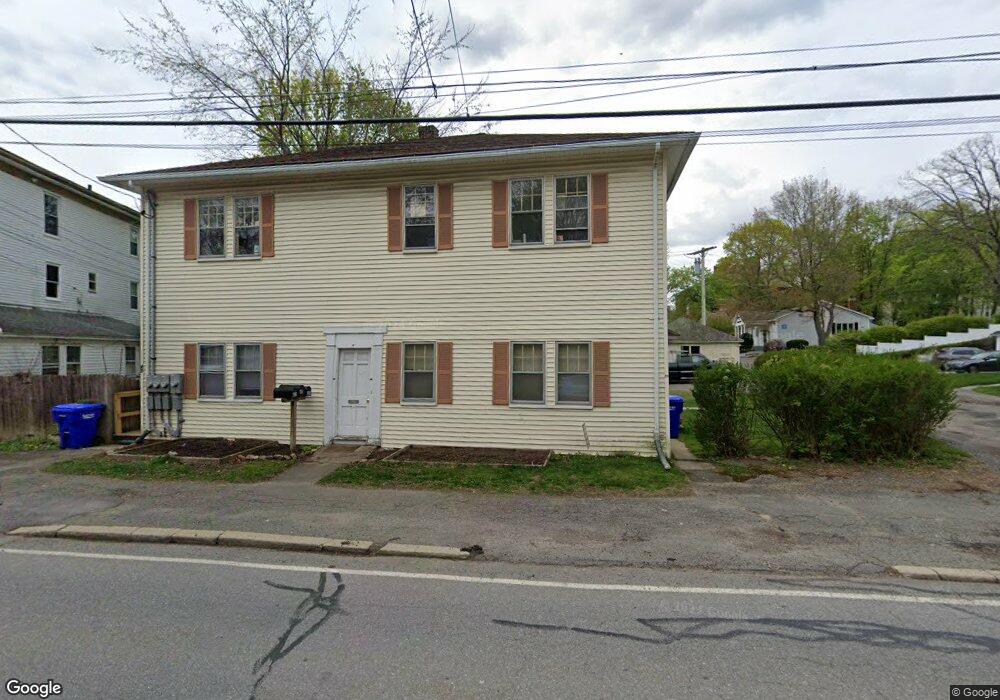
39 Walnut St Unit 43 Maynard, MA 01754
Estimated Value: $580,000 - $863,000
4
Beds
3
Baths
2,304
Sq Ft
$318/Sq Ft
Est. Value
About This Home
This home is located at 39 Walnut St Unit 43, Maynard, MA 01754 and is currently estimated at $731,685, approximately $317 per square foot. 39 Walnut St Unit 43 is a home located in Middlesex County with nearby schools including Green Meadow School, Fowler School, and Maynard High School.
Ownership History
Date
Name
Owned For
Owner Type
Purchase Details
Closed on
Dec 15, 2025
Sold by
Jrm Llc
Bought by
Kathleen Ann Foley Lt and Foley
Current Estimated Value
Purchase Details
Closed on
Feb 8, 2024
Sold by
Foley Kathleen A
Bought by
Jrm Llc
Purchase Details
Closed on
Apr 29, 2003
Sold by
Bross Edward W and Bross Linda J
Bought by
Foley Kathleen A
Home Financials for this Owner
Home Financials are based on the most recent Mortgage that was taken out on this home.
Original Mortgage
$245,000
Interest Rate
5.64%
Mortgage Type
Purchase Money Mortgage
Purchase Details
Closed on
May 1, 1998
Sold by
Croft Adele L
Bought by
Bross Edward W and Bross Linda J
Home Financials for this Owner
Home Financials are based on the most recent Mortgage that was taken out on this home.
Original Mortgage
$158,400
Interest Rate
7.04%
Mortgage Type
Purchase Money Mortgage
Create a Home Valuation Report for This Property
The Home Valuation Report is an in-depth analysis detailing your home's value as well as a comparison with similar homes in the area
Home Values in the Area
Average Home Value in this Area
Purchase History
| Date | Buyer | Sale Price | Title Company |
|---|---|---|---|
| Kathleen Ann Foley Lt | -- | -- | |
| Jrm Llc | -- | None Available | |
| Foley Kathleen A | $350,000 | -- | |
| Foley Kathleen A | $350,000 | -- | |
| Bross Edward W | $172,000 | -- | |
| Bross Edward W | $172,000 | -- |
Source: Public Records
Mortgage History
| Date | Status | Borrower | Loan Amount |
|---|---|---|---|
| Previous Owner | Foley Kathleen A | $245,000 | |
| Previous Owner | Bross Edward W | $20,000 | |
| Previous Owner | Bross Edward W | $158,400 |
Source: Public Records
Tax History
| Year | Tax Paid | Tax Assessment Tax Assessment Total Assessment is a certain percentage of the fair market value that is determined by local assessors to be the total taxable value of land and additions on the property. | Land | Improvement |
|---|---|---|---|---|
| 2025 | $9,152 | $513,300 | $270,900 | $242,400 |
| 2024 | $8,947 | $500,400 | $258,000 | $242,400 |
| 2023 | $8,986 | $473,700 | $245,700 | $228,000 |
| 2022 | $8,548 | $434,400 | $206,400 | $228,000 |
| 2021 | $8,548 | $424,200 | $206,400 | $217,800 |
| 2020 | $8,351 | $404,600 | $186,800 | $217,800 |
| 2019 | $7,686 | $365,300 | $178,400 | $186,900 |
| 2018 | $7,557 | $333,800 | $162,200 | $171,600 |
| 2017 | $7,347 | $333,800 | $162,200 | $171,600 |
| 2016 | $7,093 | $333,800 | $162,200 | $171,600 |
| 2015 | $7,501 | $336,200 | $154,800 | $181,400 |
| 2014 | $7,842 | $351,800 | $149,900 | $201,900 |
Source: Public Records
Map
Nearby Homes
- 38 Fairfield St
- 13 Arthur St Unit 15
- 5 Hayes St Unit 5
- 31-33 Roosevelt St
- 22 Douglas Ave Unit 2
- 22 Douglas Ave Unit 1
- 2 Wall Ct
- 68 Powder Mill Rd
- 70 Powder Mill Rd
- 12 Brown St
- 23 Deer Path Unit 5
- 41 Taylor Rd
- 36 Brown St
- 6 Nancy Cir
- 153 Summer St
- 1 Carlton Dr
- 8 Snowberry Ln
- 63 Conant St
- 57 Longfellow Rd
- 48 Chanticleer Rd
- 45 Walnut St Unit 49
- 42 Walnut St Unit 44
- 1 School St
- 1 School St Unit C
- 1 School St Unit A
- 42-44 Walnut St Unit 1
- 38 Walnut St Unit 40
- 40 Walnut St Unit 38-40 Walnut St 40
- 40 Walnut St Unit 40 Walnut St. Maynar
- 38-40 Walnut St
- 33 Parker St
- 33 Parker St Unit B
- 33 Parker St Unit A
- 33A Parker St Unit A
- 33B Parker St Unit 33B
- 34 Parker St
- 32 Parker St
- 35 Walnut St
- 36 Walnut St
- 39 Parker St
Your Personal Tour Guide
Ask me questions while you tour the home.