
Seller's Agent in 2025
Richard Pignone
Pignone Realty Group LLC
(781) 799-7060
1 in this area
24 Total Sales

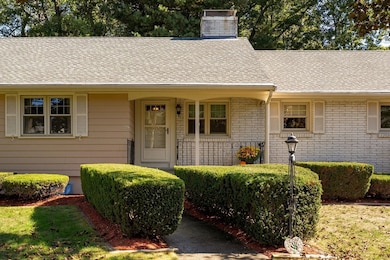

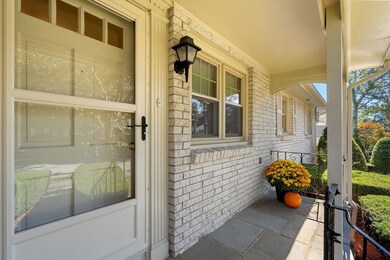
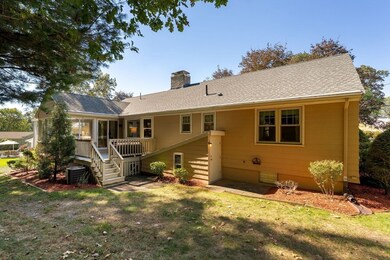
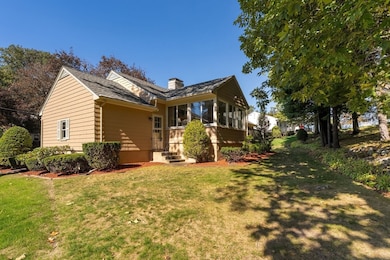
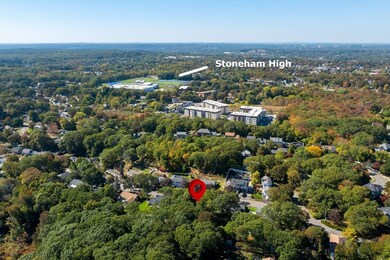
Welcome to 39 Walsh Ave, a beautifully maintained ranch in one of Stoneham’s most desirable neighborhoods. Located in the sought after Colonial Park School district and just a stone’s throw from the brand new high school, this home sits on a quiet, tree-lined street with no cut-through traffic. Perfectly positioned just minutes from the commuter rail and bus stop, it offers both convenience and tranquility. Inside, you’ll find gleaming hardwood floors, an open floor plan ideal for entertaining, and three spacious bedrooms. It has a newer roof, newer gutters with heating coils, and central air for year-round comfort. A gorgeous heated sunroom off the back provides the perfect place to relax and enjoy views of nature, with a deck just outside for summer gatherings. TONS of closets including a walk in Cedar.The backyard abuts conservation land, offering privacy and a peaceful setting. A huge basement provides endless potential, just waiting to be finished and customized to fit your needs
| Date | Type | Sale Price | Title Company |
|---|---|---|---|
| Quit Claim Deed | $930,000 | -- | |
| Quit Claim Deed | -- | None Available | |
| Quit Claim Deed | -- | None Available | |
| Land Court Massachusetts | -- | -- | |
| Land Court Massachusetts | -- | -- | |
| Land Court Massachusetts | -- | -- |
| Date | Event | Price | List to Sale | Price per Sq Ft |
|---|---|---|---|---|
| 11/12/2025 11/12/25 | Sold | $930,000 | +5.8% | $336 / Sq Ft |
| 10/14/2025 10/14/25 | Pending | -- | -- | -- |
| 10/08/2025 10/08/25 | For Sale | $879,000 | -- | $317 / Sq Ft |
| Year | Tax Paid | Tax Assessment Tax Assessment Total Assessment is a certain percentage of the fair market value that is determined by local assessors to be the total taxable value of land and additions on the property. | Land | Improvement |
|---|---|---|---|---|
| 2025 | $7,820 | $764,400 | $401,600 | $362,800 |
| 2024 | $7,563 | $714,200 | $371,600 | $342,600 |
| 2023 | $7,439 | $670,200 | $341,600 | $328,600 |
| 2022 | $6,591 | $633,100 | $321,600 | $311,500 |
| 2021 | $6,477 | $598,600 | $301,600 | $297,000 |
| 2020 | $6,468 | $599,400 | $301,600 | $297,800 |
| 2019 | $6,232 | $555,400 | $271,600 | $283,800 |
| 2018 | $6,042 | $516,000 | $251,600 | $264,400 |
| 2017 | $5,934 | $478,900 | $241,600 | $237,300 |
| 2016 | $5,799 | $456,600 | $241,600 | $215,000 |
| 2015 | $5,680 | $438,300 | $241,600 | $196,700 |
| 2014 | $5,385 | $399,200 | $221,600 | $177,600 |
Seller's Agent in 2025
Richard Pignone
Pignone Realty Group LLC
(781) 799-7060
1 in this area
24 Total Sales
Buyer's Agent in 2025
Ryan Wilson
Keller Williams Realty
(781) 424-6286
1 in this area
660 Total Sales
Source: MLS Property Information Network (MLS PIN)
MLS Number: 73441497
APN: STON-000002-000000-000233
Disclaimer: Certain information contained herein is derived from information provided by parties other than Homes.com. All information provided is deemed reliable, but is not guaranteed to be accurate and should be independently verified.
![]() The property listing data and information, or the Images, set forth herein were provided to MLS Property Information Network, Inc. from third party sources, including sellers, lessors and public records, and were compiled by MLS Property Information Network, Inc. The property listing data and information, and the Images, are for the personal, non-commercial use of consumers having a good faith interest in purchasing or leasing listed properties of the type displayed to them and may not be used for any purpose other than to identify prospective properties which such consumers may have a good faith interest in purchasing or leasing. MLS Property Information Network, Inc. and its subscribers disclaim any and all representations and warranties as to the accuracy of the property listing data and information, or as to the accuracy of any of the Images, set forth herein.
The property listing data and information, or the Images, set forth herein were provided to MLS Property Information Network, Inc. from third party sources, including sellers, lessors and public records, and were compiled by MLS Property Information Network, Inc. The property listing data and information, and the Images, are for the personal, non-commercial use of consumers having a good faith interest in purchasing or leasing listed properties of the type displayed to them and may not be used for any purpose other than to identify prospective properties which such consumers may have a good faith interest in purchasing or leasing. MLS Property Information Network, Inc. and its subscribers disclaim any and all representations and warranties as to the accuracy of the property listing data and information, or as to the accuracy of any of the Images, set forth herein.
Ask me questions while you tour the home.