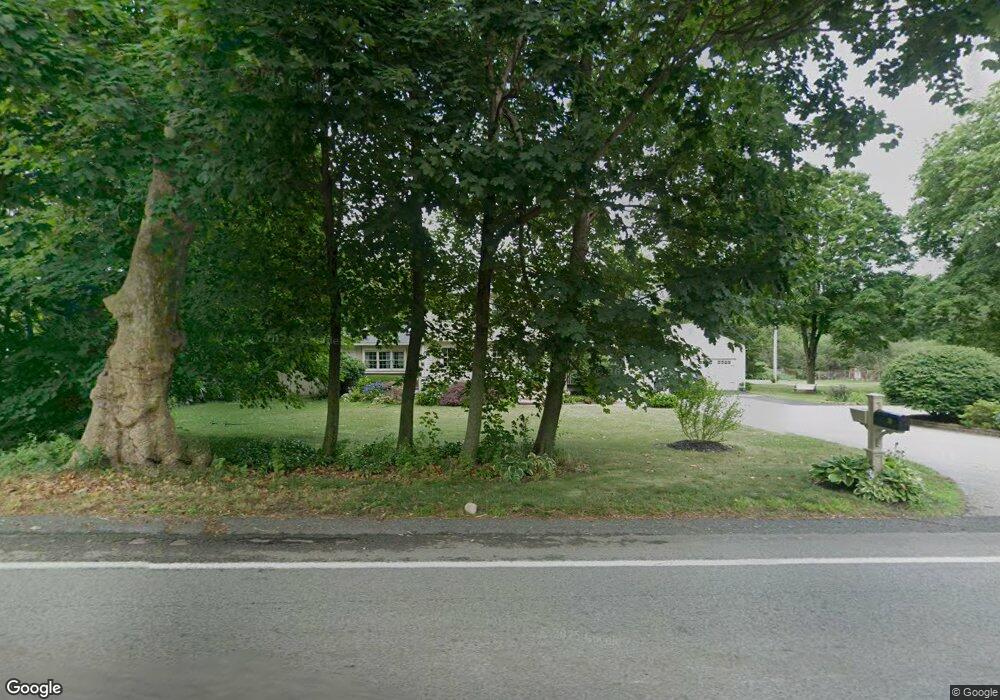
39 Wapping Rd Kingston, MA 02364
Estimated Value: $563,000 - $656,000
3
Beds
2
Baths
1,562
Sq Ft
$387/Sq Ft
Est. Value
About This Home
This home is located at 39 Wapping Rd, Kingston, MA 02364 and is currently estimated at $604,574, approximately $387 per square foot. 39 Wapping Rd is a home located in Plymouth County with nearby schools including Kingston Elementary School, Silver Lake Regional High School, and Kingston Intermediate School.
Ownership History
Date
Name
Owned For
Owner Type
Purchase Details
Closed on
Feb 14, 2024
Sold by
Woodbury Deborah J
Bought by
Deborahh J Woodbury Irt and Munson
Current Estimated Value
Purchase Details
Closed on
Apr 29, 1994
Sold by
Commercial Credit Corp
Bought by
Young Lynne and Correa Paul J
Home Financials for this Owner
Home Financials are based on the most recent Mortgage that was taken out on this home.
Original Mortgage
$76,000
Interest Rate
7.7%
Mortgage Type
Purchase Money Mortgage
Purchase Details
Closed on
Nov 8, 1993
Sold by
Foulsham Donna J
Bought by
Commercial Credit Corp
Create a Home Valuation Report for This Property
The Home Valuation Report is an in-depth analysis detailing your home's value as well as a comparison with similar homes in the area
Home Values in the Area
Average Home Value in this Area
Purchase History
| Date | Buyer | Sale Price | Title Company |
|---|---|---|---|
| Deborahh J Woodbury Irt | -- | None Available | |
| Young Lynne | $95,000 | -- | |
| Commercial Credit Corp | $14,000 | -- |
Source: Public Records
Mortgage History
| Date | Status | Borrower | Loan Amount |
|---|---|---|---|
| Previous Owner | Commercial Credit Corp | $76,000 | |
| Previous Owner | Commercial Credit Corp | $31,917 | |
| Previous Owner | Commercial Credit Corp | $15,000 |
Source: Public Records
Tax History
| Year | Tax Paid | Tax Assessment Tax Assessment Total Assessment is a certain percentage of the fair market value that is determined by local assessors to be the total taxable value of land and additions on the property. | Land | Improvement |
|---|---|---|---|---|
| 2025 | $6,756 | $520,900 | $217,700 | $303,200 |
| 2024 | $5,925 | $466,200 | $189,300 | $276,900 |
| 2023 | $5,731 | $429,000 | $189,300 | $239,700 |
| 2022 | $5,570 | $382,000 | $172,100 | $209,900 |
| 2021 | $5,462 | $339,700 | $172,100 | $167,600 |
| 2020 | $5,433 | $333,700 | $172,100 | $161,600 |
| 2019 | $5,363 | $325,800 | $172,100 | $153,700 |
| 2018 | $5,065 | $307,900 | $172,100 | $135,800 |
| 2017 | $4,897 | $296,800 | $164,600 | $132,200 |
| 2016 | $4,637 | $263,300 | $150,600 | $112,700 |
| 2015 | $4,492 | $265,200 | $150,600 | $114,600 |
| 2014 | $4,454 | $267,000 | $150,600 | $116,400 |
Source: Public Records
Map
Nearby Homes
- 64 Wapping Rd
- 1 Oldfield Dr
- 10 Wapping Rd
- 2 Clinton Terrace
- 35 Grove St
- 46 Foxworth Ln
- 83 Wapping Rd
- 138 Elm St Unit 30
- 138 Elm St Unit 38
- Lot 17-1 Howland's Ln
- 23 Bog View Rd
- 10 Pine Brook Dr
- 38 Landing Rd
- 47 Holly Cir
- 40 Landing Rd
- 342 Country Club Way
- 23 Green Holly Dr Unit 23
- 16 Copper Beech Dr Marion Dr
- 4 Green Holly Dr
- 74 Tussock Brook Rd Unit 74
Your Personal Tour Guide
Ask me questions while you tour the home.