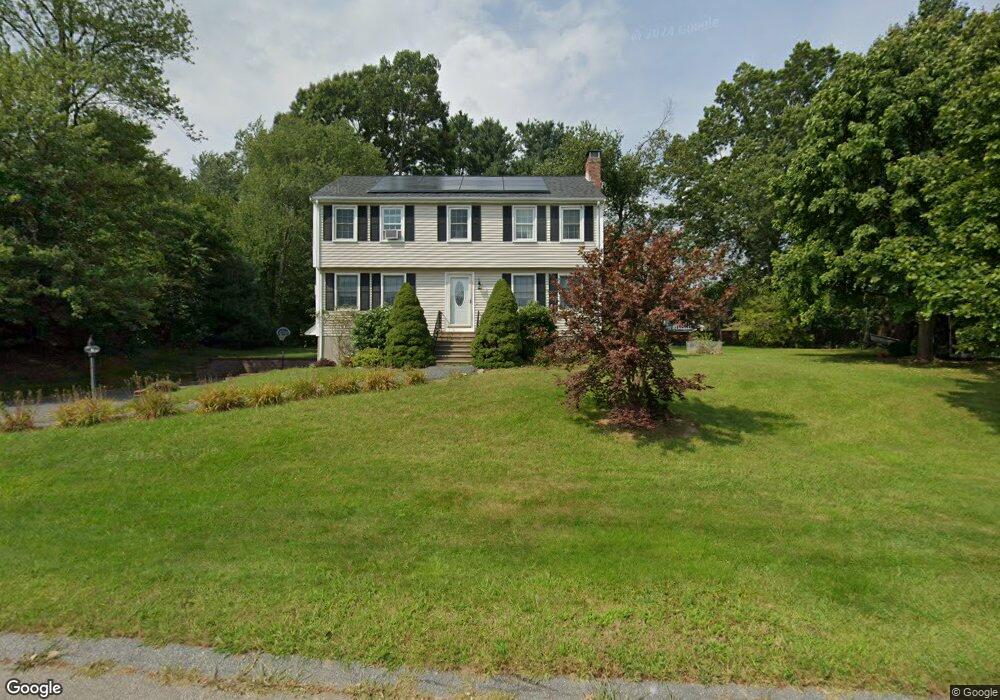
39 Waterview Dr Medway, MA 02053
Estimated Value: $664,000 - $727,000
4
Beds
3
Baths
1,800
Sq Ft
$389/Sq Ft
Est. Value
About This Home
This home is located at 39 Waterview Dr, Medway, MA 02053 and is currently estimated at $700,631, approximately $389 per square foot. 39 Waterview Dr is a home located in Norfolk County with nearby schools including John D. McGovern Elementary School, Burke-Memorial Elementary, and Medway Middle School.
Ownership History
Date
Name
Owned For
Owner Type
Purchase Details
Closed on
Dec 10, 2021
Sold by
Earle Michelle S and Houle Todd
Bought by
Earle Michelle S and Houle Todd
Current Estimated Value
Purchase Details
Closed on
Feb 23, 2021
Sold by
Earle Michelle S
Bought by
Earle Michelle S and Houle Todd
Home Financials for this Owner
Home Financials are based on the most recent Mortgage that was taken out on this home.
Original Mortgage
$228,000
Interest Rate
2.7%
Mortgage Type
New Conventional
Purchase Details
Closed on
Apr 13, 2015
Sold by
Earle Michelle S and Earle James F
Bought by
Earle Michelle S
Home Financials for this Owner
Home Financials are based on the most recent Mortgage that was taken out on this home.
Original Mortgage
$268,000
Interest Rate
3.77%
Mortgage Type
New Conventional
Purchase Details
Closed on
Mar 7, 2012
Sold by
Earle Michelle S
Bought by
Earle Michelle S and Earle James F
Home Financials for this Owner
Home Financials are based on the most recent Mortgage that was taken out on this home.
Original Mortgage
$309,500
Interest Rate
3.99%
Mortgage Type
New Conventional
Purchase Details
Closed on
Jan 31, 2011
Sold by
Anderson Neil W and Anderson Tawana C
Bought by
Machon Michelle S
Purchase Details
Closed on
Aug 27, 2003
Sold by
Williams Alex H and Williams Charlotte P
Bought by
Anderson Neil W and Anderson Tawana C
Purchase Details
Closed on
Feb 15, 2002
Sold by
Doucet Glenn A and Doucet Julie A
Bought by
Williams Alex H and Williams Charlotte P
Purchase Details
Closed on
May 15, 1998
Sold by
Garino Vincent R and Garino Johanne M
Bought by
Doucet Glen and Doucet Julie A
Create a Home Valuation Report for This Property
The Home Valuation Report is an in-depth analysis detailing your home's value as well as a comparison with similar homes in the area
Home Values in the Area
Average Home Value in this Area
Purchase History
| Date | Buyer | Sale Price | Title Company |
|---|---|---|---|
| Earle Michelle S | -- | None Available | |
| Earle Michelle S | -- | None Available | |
| Earle Michelle S | -- | None Available | |
| Earle Michelle S | -- | None Available | |
| Earle Michelle S | -- | -- | |
| Earle Michelle S | -- | -- | |
| Earle Michelle S | -- | -- | |
| Earle Michelle S | -- | -- | |
| Earle Michelle S | -- | -- | |
| Machon Michelle S | -- | -- | |
| Machon Michelle S | -- | -- | |
| Machon Michelle S | -- | -- | |
| Anderson Neil W | $388,900 | -- | |
| Anderson Neil W | $388,900 | -- | |
| Williams Alex H | $337,000 | -- | |
| Williams Alex H | $337,000 | -- | |
| Williams Alex H | $337,000 | -- | |
| Doucet Glen | $195,000 | -- | |
| Doucet Glen | $195,000 | -- |
Source: Public Records
Mortgage History
| Date | Status | Borrower | Loan Amount |
|---|---|---|---|
| Previous Owner | Earle Michelle S | $228,000 | |
| Previous Owner | Earle Michelle S | $268,000 | |
| Previous Owner | Earle Michelle S | $309,500 |
Source: Public Records
Tax History Compared to Growth
Tax History
| Year | Tax Paid | Tax Assessment Tax Assessment Total Assessment is a certain percentage of the fair market value that is determined by local assessors to be the total taxable value of land and additions on the property. | Land | Improvement |
|---|---|---|---|---|
| 2025 | $8,195 | $575,100 | $329,400 | $245,700 |
| 2024 | $8,281 | $575,100 | $329,400 | $245,700 |
| 2023 | $8,239 | $516,900 | $299,800 | $217,100 |
| 2022 | $7,175 | $423,800 | $217,900 | $205,900 |
| 2021 | $7,150 | $409,500 | $203,300 | $206,200 |
| 2020 | $7,016 | $400,900 | $203,300 | $197,600 |
| 2019 | $6,608 | $389,400 | $195,000 | $194,400 |
| 2018 | $6,645 | $376,300 | $186,700 | $189,600 |
| 2017 | $6,611 | $368,900 | $182,600 | $186,300 |
| 2016 | $6,418 | $354,400 | $168,100 | $186,300 |
| 2015 | $6,351 | $348,200 | $166,000 | $182,200 |
| 2014 | $6,174 | $327,700 | $166,000 | $161,700 |
Source: Public Records
Map
Nearby Homes
- 220 Main St Unit 220
- 5 Fales St
- 28 Wellington St
- 21 Riverside Rd
- 176 Main St Unit 3
- 6 Freedom Trail
- 4 Shaw St
- 280 Village St Unit D2
- 18 Mary Anne Dr
- 462 Hartford Ave
- 39 West St
- 455 Hartford Ave
- 951 Pond St
- 14 Hawthorne Village Unit D
- 0 Old Log Lane (Farm St) Unit 73416329
- 0 Elm St
- 22 Sunset Dr
- 14 Heritage Dr
- 387 Hartford Ave
- 7 Gloucester Dr
- 37 Waterview Dr
- 40 Waterview Dr
- 2 Franklin St
- 2 Franklin St Unit A
- 353 Village St
- 355 Village St
- 38 Waterview Dr
- 357 Village St
- 35 Waterview Dr
- 0 Pond Unit 24285018
- 0 Pond Unit 70671648
- 6 Franklin St
- 359A Village St
- 359 Village St
- 28 Sahlin Cir
- 36 Waterview Dr
- 21 Haverstock Rd
- 26 Sahlin Cir
- 27 Haverstock Rd
- 23 Haverstock Rd