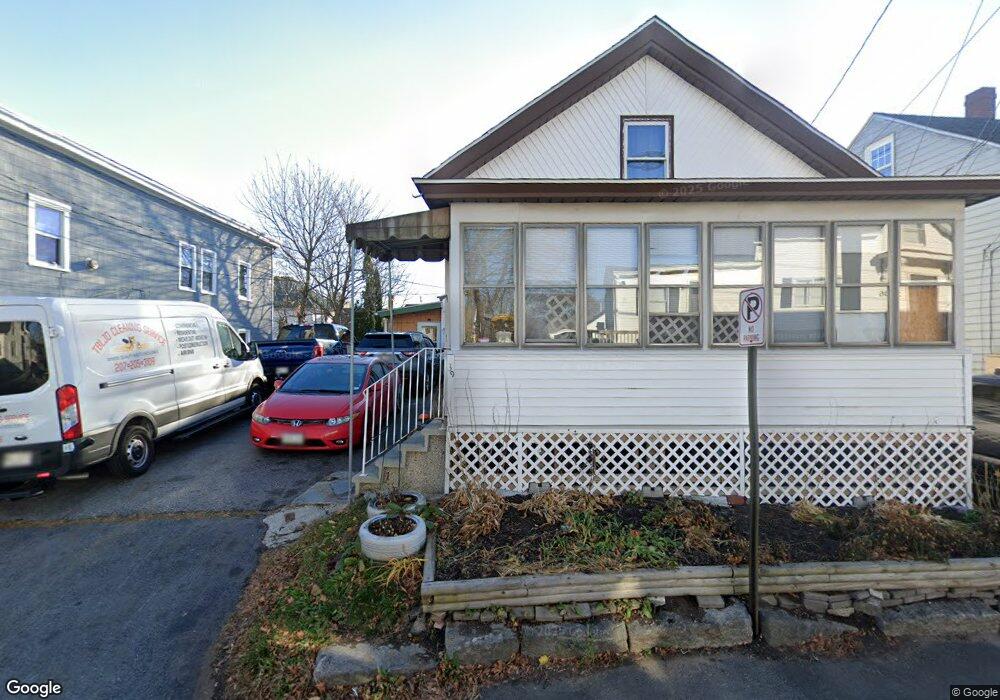
39 Wentworth St Biddeford, ME 04005
Downtown Biddeford NeighborhoodEstimated Value: $339,000 - $405,167
4
Beds
2
Baths
1,875
Sq Ft
$202/Sq Ft
Est. Value
About This Home
This home is located at 39 Wentworth St, Biddeford, ME 04005 and is currently estimated at $378,292, approximately $201 per square foot. 39 Wentworth St is a home located in York County with nearby schools including John F Kennedy Memorial School, Biddeford Primary School, and Biddeford Intermediate School.
Ownership History
Date
Name
Owned For
Owner Type
Purchase Details
Closed on
Nov 17, 2023
Sold by
Wright Daliah M
Bought by
Wright Daliah M
Current Estimated Value
Home Financials for this Owner
Home Financials are based on the most recent Mortgage that was taken out on this home.
Original Mortgage
$203,194
Outstanding Balance
$199,737
Interest Rate
7.63%
Mortgage Type
FHA
Estimated Equity
$178,555
Purchase Details
Closed on
Sep 4, 2007
Sold by
Morin Pearl M
Bought by
Murphy Daliah M
Home Financials for this Owner
Home Financials are based on the most recent Mortgage that was taken out on this home.
Original Mortgage
$145,500
Interest Rate
6.71%
Mortgage Type
Purchase Money Mortgage
Create a Home Valuation Report for This Property
The Home Valuation Report is an in-depth analysis detailing your home's value as well as a comparison with similar homes in the area
Home Values in the Area
Average Home Value in this Area
Purchase History
| Date | Buyer | Sale Price | Title Company |
|---|---|---|---|
| Wright Daliah M | -- | None Available | |
| Murphy Daliah M | -- | -- |
Source: Public Records
Mortgage History
| Date | Status | Borrower | Loan Amount |
|---|---|---|---|
| Open | Wright Daliah M | $203,194 | |
| Previous Owner | Murphy Daliah M | $145,500 | |
| Previous Owner | Murphy Daliah M | $9,327 |
Source: Public Records
Tax History Compared to Growth
Tax History
| Year | Tax Paid | Tax Assessment Tax Assessment Total Assessment is a certain percentage of the fair market value that is determined by local assessors to be the total taxable value of land and additions on the property. | Land | Improvement |
|---|---|---|---|---|
| 2024 | $2,830 | $199,000 | $121,100 | $77,900 |
| 2023 | $2,611 | $199,000 | $121,100 | $77,900 |
| 2022 | $2,645 | $161,200 | $62,500 | $98,700 |
| 2021 | $2,470 | $135,500 | $51,200 | $84,300 |
| 2020 | $2,352 | $117,300 | $39,800 | $77,500 |
| 2019 | $2,344 | $117,300 | $39,800 | $77,500 |
| 2018 | $2,311 | $117,300 | $39,800 | $77,500 |
| 2017 | $2,149 | $107,100 | $39,800 | $67,300 |
| 2016 | $2,127 | $107,100 | $39,800 | $67,300 |
| 2015 | $1,891 | $107,100 | $39,800 | $67,300 |
| 2014 | $1,844 | $107,100 | $39,800 | $67,300 |
| 2013 | -- | $142,300 | $50,800 | $91,500 |
Source: Public Records
Map
Nearby Homes
- 39 Green St
- 4 Kossuth St
- 38 South St
- 28 Cutts St
- 38 Jefferson St
- 109 Alfred Rd
- 391 Main St
- 19 Lessard Ave
- 99 Summer St
- 11 King St
- 138 Summer St
- 6 Victory Ln
- 155 Hill St
- 20 Hooper St
- 2 Main St Unit 17-506
- 2 Main St Unit 15-310
- 2 Main St Unit 18-420
- 2 Main St Unit 17-410
- 2 Main St Unit 17-508
- 2 Main St Unit 15-403