
Seller's Agent in 2026
Bret O'Brien
Greater Boston Commercial Properties, Inc.
(508) 925-7477
1 in this area
33 Total Sales
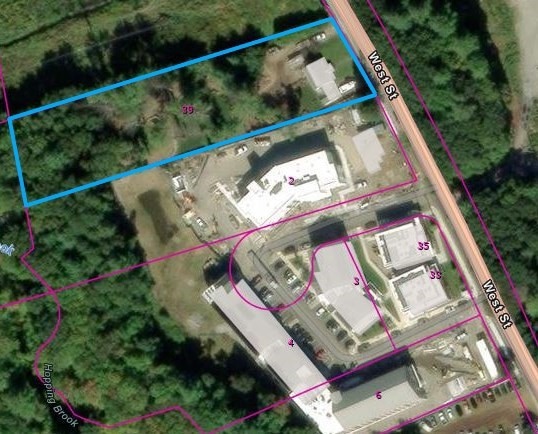
This home is located at 39 West St, Medway, MA 02053 and is currently priced at $1,325,000, approximately $1,250 per square foot. 39 West St is a home located in Norfolk County with nearby schools including John D. McGovern Elementary School, Burke-Memorial Elementary, and Medway Middle School.
Last Agent to Sell the Property
Greater Boston Commercial Properties, Inc. Listed on: 10/07/2024
| Date | Type | Sale Price | Title Company |
|---|---|---|---|
| Quit Claim Deed | $1,325,000 | -- | |
| Not Resolvable | $250,000 | -- | |
| Quit Claim Deed | $152,500 | -- | |
| Deed | -- | -- | |
| Deed | -- | -- | |
| Deed | -- | -- | |
| Deed | -- | -- | |
| Deed | -- | -- |
| Date | Status | Loan Amount | Loan Type |
|---|---|---|---|
| Open | $993,750 | Purchase Money Mortgage | |
| Previous Owner | $225,000 | New Conventional | |
| Previous Owner | $145,945 | New Conventional |
| Date | Event | Price | List to Sale | Price per Sq Ft | Prior Sale |
|---|---|---|---|---|---|
| 02/10/2026 02/10/26 | Sold | $1,325,000 | -5.4% | $1,250 / Sq Ft | |
| 01/13/2025 01/13/25 | Price Changed | $1,400,000 | +16.7% | $1,321 / Sq Ft | |
| 10/07/2024 10/07/24 | For Sale | $1,200,000 | +686.9% | $1,132 / Sq Ft | |
| 02/23/2012 02/23/12 | Sold | $152,500 | -9.6% | $144 / Sq Ft | View Prior Sale |
| 01/11/2012 01/11/12 | Pending | -- | -- | -- | |
| 12/02/2011 12/02/11 | Price Changed | $168,750 | -4.9% | $159 / Sq Ft | |
| 10/24/2011 10/24/11 | For Sale | $177,500 | -- | $167 / Sq Ft |
| Year | Tax Paid | Tax Assessment Tax Assessment Total Assessment is a certain percentage of the fair market value that is determined by local assessors to be the total taxable value of land and additions on the property. | Land | Improvement |
|---|---|---|---|---|
| 2025 | $5,941 | $416,900 | $271,500 | $145,400 |
| 2024 | $6,003 | $416,900 | $271,500 | $145,400 |
| 2023 | $5,694 | $357,200 | $234,200 | $123,000 |
| 2022 | $5,550 | $327,800 | $209,400 | $118,400 |
| 2021 | $5,191 | $297,300 | $188,700 | $108,600 |
| 2020 | $4,932 | $281,800 | $168,000 | $113,800 |
| 2019 | $5,013 | $295,400 | $184,600 | $110,800 |
| 2018 | $4,779 | $270,600 | $159,800 | $110,800 |
| 2017 | $4,908 | $273,900 | $168,000 | $105,900 |
| 2016 | $4,614 | $254,800 | $148,900 | $105,900 |
| 2015 | $4,162 | $228,200 | $133,200 | $95,000 |
| 2014 | $4,588 | $243,500 | $144,400 | $99,100 |
Seller's Agent in 2026
Bret O'Brien
Greater Boston Commercial Properties, Inc.
(508) 925-7477
1 in this area
33 Total Sales
L
Seller's Agent in 2012
Linda Abrams
ERA Key Realty Services- Milf
(508) 735-7744
1 in this area
36 Total Sales
Buyer's Agent in 2012
Gail Bernardo
Bernardo Real Estate
(508) 802-1585
1 in this area
6 Total Sales
Source: MLS Property Information Network (MLS PIN)
MLS Number: 73299351
APN: MEDW-000055-000000-000051
Disclaimer: Certain information contained herein is derived from information provided by parties other than Homes.com. All information provided is deemed reliable, but is not guaranteed to be accurate and should be independently verified.
![]() The property listing data and information, or the Images, set forth herein were provided to MLS Property Information Network, Inc. from third party sources, including sellers, lessors and public records, and were compiled by MLS Property Information Network, Inc. The property listing data and information, and the Images, are for the personal, non-commercial use of consumers having a good faith interest in purchasing or leasing listed properties of the type displayed to them and may not be used for any purpose other than to identify prospective properties which such consumers may have a good faith interest in purchasing or leasing. MLS Property Information Network, Inc. and its subscribers disclaim any and all representations and warranties as to the accuracy of the property listing data and information, or as to the accuracy of any of the Images, set forth herein.
The property listing data and information, or the Images, set forth herein were provided to MLS Property Information Network, Inc. from third party sources, including sellers, lessors and public records, and were compiled by MLS Property Information Network, Inc. The property listing data and information, and the Images, are for the personal, non-commercial use of consumers having a good faith interest in purchasing or leasing listed properties of the type displayed to them and may not be used for any purpose other than to identify prospective properties which such consumers may have a good faith interest in purchasing or leasing. MLS Property Information Network, Inc. and its subscribers disclaim any and all representations and warranties as to the accuracy of the property listing data and information, or as to the accuracy of any of the Images, set forth herein.
Ask me questions while you tour the home.