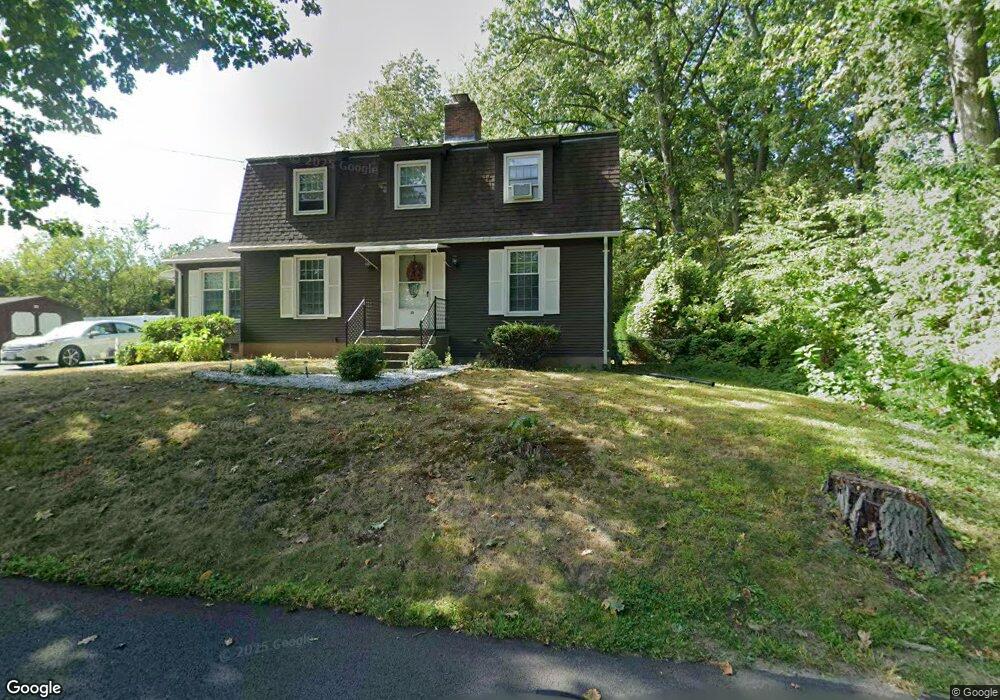
39 Wilfred St West Springfield, MA 01089
Estimated Value: $412,170 - $456,000
3
Beds
2
Baths
2,238
Sq Ft
$194/Sq Ft
Est. Value
About This Home
This home is located at 39 Wilfred St, West Springfield, MA 01089 and is currently estimated at $434,293, approximately $194 per square foot. 39 Wilfred St is a home located in Hampden County with nearby schools including West Springfield High School, Holyoke Community Charter School, and Blessed Sacrament School.
Ownership History
Date
Name
Owned For
Owner Type
Purchase Details
Closed on
Apr 11, 2005
Sold by
Jarry Dorothy J and Jarry Kenneth F
Bought by
Casineau Lori A and Casineau Scott J
Current Estimated Value
Home Financials for this Owner
Home Financials are based on the most recent Mortgage that was taken out on this home.
Original Mortgage
$206,000
Outstanding Balance
$105,752
Interest Rate
5.7%
Mortgage Type
Purchase Money Mortgage
Estimated Equity
$328,541
Create a Home Valuation Report for This Property
The Home Valuation Report is an in-depth analysis detailing your home's value as well as a comparison with similar homes in the area
Home Values in the Area
Average Home Value in this Area
Purchase History
| Date | Buyer | Sale Price | Title Company |
|---|---|---|---|
| Casineau Lori A | $257,500 | -- |
Source: Public Records
Mortgage History
| Date | Status | Borrower | Loan Amount |
|---|---|---|---|
| Open | Casineau Lori A | $206,000 |
Source: Public Records
Tax History
| Year | Tax Paid | Tax Assessment Tax Assessment Total Assessment is a certain percentage of the fair market value that is determined by local assessors to be the total taxable value of land and additions on the property. | Land | Improvement |
|---|---|---|---|---|
| 2025 | $4,889 | $328,800 | $99,500 | $229,300 |
| 2024 | $4,650 | $314,000 | $99,500 | $214,500 |
| 2023 | $4,438 | $285,600 | $97,400 | $188,200 |
| 2022 | $4,063 | $257,800 | $88,400 | $169,400 |
| 2021 | $3,980 | $235,500 | $81,900 | $153,600 |
| 2020 | $4,001 | $235,500 | $81,900 | $153,600 |
| 2019 | $3,994 | $235,500 | $81,900 | $153,600 |
| 2018 | $4,015 | $235,500 | $81,900 | $153,600 |
| 2017 | $4,015 | $235,500 | $81,900 | $153,600 |
| 2016 | $4,032 | $237,300 | $77,000 | $160,300 |
| 2015 | $3,957 | $232,900 | $75,500 | $157,400 |
| 2014 | $947 | $229,500 | $75,500 | $154,000 |
Source: Public Records
Map
Nearby Homes
- 11 Annie's Way
- 80 Brush Hill Ave Unit 61
- 361 Prospect Ave
- 404 Brush Hill Ave
- 87 Blanchwood Ave
- 86 Beaumont Ave
- 89-111 Whitney Ave
- 51 Beaumont Ave
- 67 Redden Rd
- 76 Joy St
- 439 Oldfield Rd
- 21 Depot St
- 269 Chicopee St Unit 6
- 35 Dublin St
- 0 School St
- 27 Abbey St
- 13 Beston St
- 87 Clarendon Ave
- 343 Chicopee St Unit 14
- 69 Beston St
Your Personal Tour Guide
Ask me questions while you tour the home.