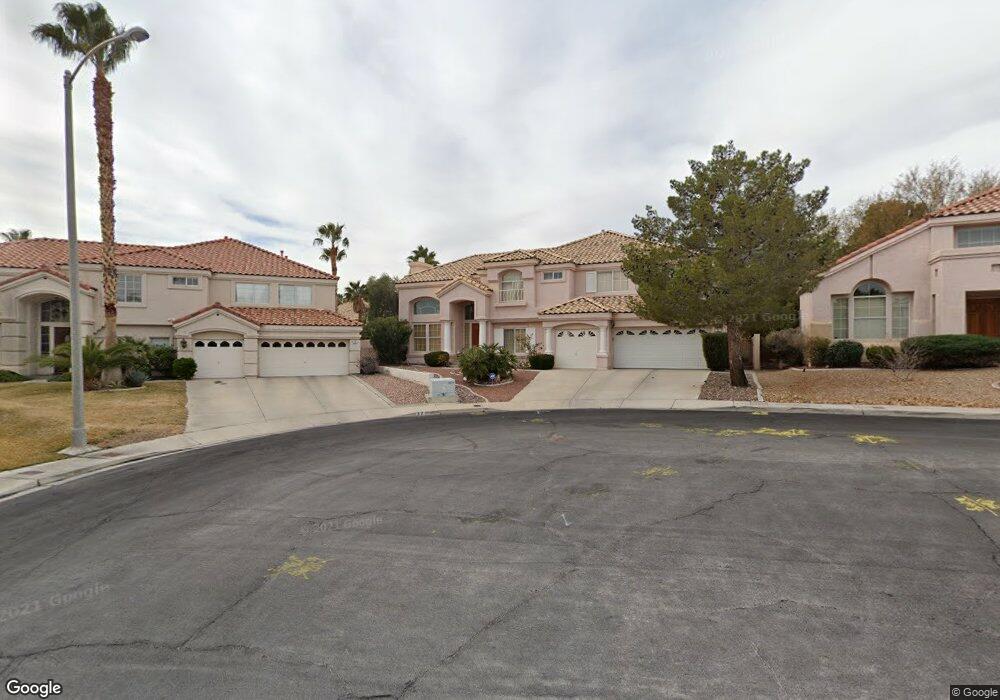
39 Willow Wisp Terrace Henderson, NV 89074
Green Valley South NeighborhoodEstimated Value: $742,000 - $778,000
5
Beds
3
Baths
3,223
Sq Ft
$236/Sq Ft
Est. Value
About This Home
This home is located at 39 Willow Wisp Terrace, Henderson, NV 89074 and is currently estimated at $760,213, approximately $235 per square foot. 39 Willow Wisp Terrace is a home located in Clark County with nearby schools including Selma F Bartlett Elementary School, Barbara and Hank Greenspun Junior High School, and Coronado High School.
Ownership History
Date
Name
Owned For
Owner Type
Purchase Details
Closed on
Aug 11, 2010
Sold by
Ming Chang Llc
Bought by
Pei Jhen Simonich Trust
Current Estimated Value
Purchase Details
Closed on
Mar 25, 2010
Sold by
Simonich Pei Jhen
Bought by
Pei Jhen Simonich Trust
Purchase Details
Closed on
Apr 30, 2009
Sold by
Pei Jehn Simonich Trust
Bought by
Ming Chang Llc
Purchase Details
Closed on
Apr 8, 2009
Sold by
Simonich Pei Jehn and Simonich Herman C
Bought by
Pei Jehn Simonich Trust
Purchase Details
Closed on
Feb 18, 2000
Sold by
Simonich Pei Jehn and Huang Wendy
Bought by
Simonich Herman C and Simonich Pei Jehn
Home Financials for this Owner
Home Financials are based on the most recent Mortgage that was taken out on this home.
Original Mortgage
$140,000
Interest Rate
8.16%
Purchase Details
Closed on
Jul 13, 1999
Sold by
C R #2 Family Ltd Partnership
Bought by
Simonich Herman and Simonich Wendy
Create a Home Valuation Report for This Property
The Home Valuation Report is an in-depth analysis detailing your home's value as well as a comparison with similar homes in the area
Home Values in the Area
Average Home Value in this Area
Purchase History
| Date | Buyer | Sale Price | Title Company |
|---|---|---|---|
| Pei Jhen Simonich Trust | -- | None Available | |
| Pei Jhen Simonich Trust | -- | None Available | |
| Ming Chang Llc | -- | None Available | |
| Pei Jehn Simonich Trust | -- | None Available | |
| Simonich Herman C | -- | Fidelity National Title | |
| Simonich Herman | $82,000 | Land Title |
Source: Public Records
Mortgage History
| Date | Status | Borrower | Loan Amount |
|---|---|---|---|
| Previous Owner | Simonich Herman C | $140,000 |
Source: Public Records
Tax History Compared to Growth
Tax History
| Year | Tax Paid | Tax Assessment Tax Assessment Total Assessment is a certain percentage of the fair market value that is determined by local assessors to be the total taxable value of land and additions on the property. | Land | Improvement |
|---|---|---|---|---|
| 2025 | $3,392 | $158,213 | $64,400 | $93,813 |
| 2024 | $3,142 | $158,213 | $64,400 | $93,813 |
| 2023 | $2,092 | $143,808 | $53,725 | $90,083 |
| 2022 | $2,909 | $126,170 | $43,680 | $82,490 |
| 2021 | $2,694 | $115,257 | $36,400 | $78,857 |
| 2020 | $2,499 | $114,049 | $35,700 | $78,349 |
| 2019 | $2,342 | $109,544 | $31,850 | $77,694 |
| 2018 | $2,234 | $104,394 | $29,750 | $74,644 |
| 2017 | $3,066 | $105,788 | $29,750 | $76,038 |
| 2016 | $2,092 | $101,823 | $24,150 | $77,673 |
| 2015 | $2,088 | $92,889 | $16,100 | $76,789 |
| 2014 | $2,027 | $67,872 | $16,975 | $50,897 |
Source: Public Records
Map
Nearby Homes
- 17 Sandwedge Dr
- 1867 Indian Bend Dr
- 75 N Valle Verde Dr Unit 524
- 75 N Valle Verde Dr Unit 1822
- 75 N Valle Verde Dr Unit 2121
- 75 N Valle Verde Dr Unit 225
- 75 N Valle Verde Dr Unit 211
- 75 N Valle Verde Dr Unit 621
- 56 Grossinger Ct
- 1910 Grey Eagle St
- 2008 Spruce Brook Dr
- 54 Ancient Hills Ln
- 1745 Sand Storm Dr
- 104 Augusta Place
- 1966 Windfall Ave
- 69 Incline Village Ct
- 1785 Lily Pond Cir
- 1773 Lily Pond Cir
- 30 Daisy Meadow Terrace Unit 1
- 13 Desert Dawn Ln
- 41 Willow Wisp Terrace
- 37 Willow Wisp Terrace
- 1859 Bogey Way
- 1857 Bogey Way
- 1861 Bogey Way
- 36 Willow Wisp Terrace
- 1855 Bogey Way
- 43 Willow Wisp Terrace
- 1863 Bogey Way
- 40 Willow Wisp Terrace
- 38 Willow Wisp Terrace
- 1853 Bogey Way
- 1858 Bogey Way
- 45 Willow Wisp Terrace
- 1842 Tee Box Way
- 42 Willow Wisp Terrace
- 1856 Bogey Way
- 1860 Bogey Way
- 1840 Tee Box Way
- 1844 Tee Box Way