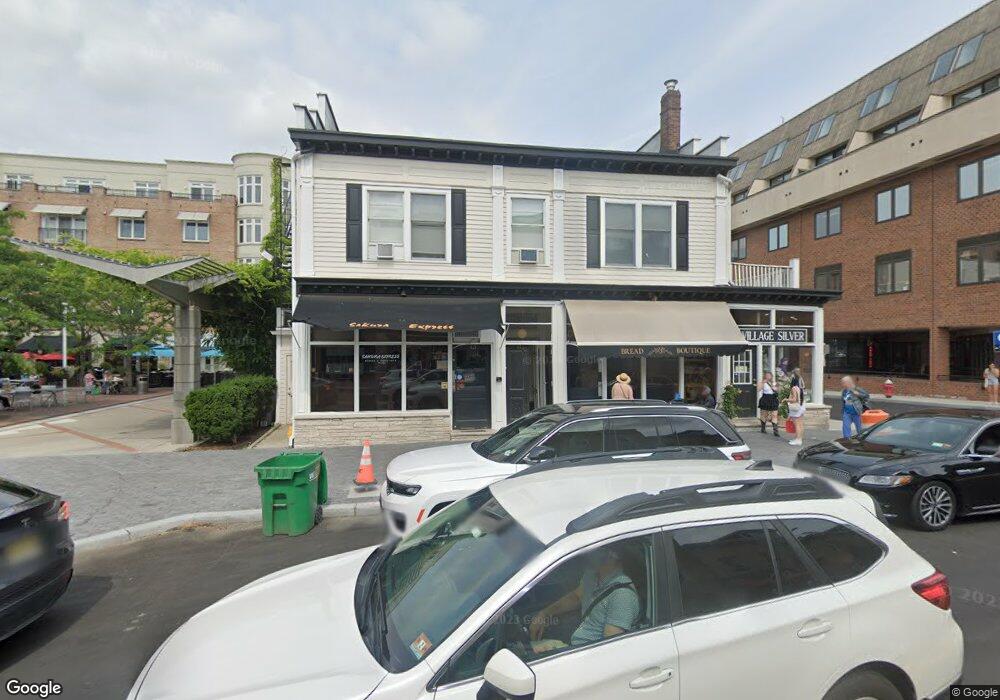
39 Witherspoon St Princeton, NJ 08542
Estimated Value: $6,222,560
--
Bed
--
Bath
5,560
Sq Ft
$1,119/Sq Ft
Est. Value
About This Home
This home is located at 39 Witherspoon St, Princeton, NJ 08542 and is currently estimated at $6,222,560, approximately $1,119 per square foot. 39 Witherspoon St is a home located in Mercer County with nearby schools including Community Park Elementary School, Princeton Middle School, and Princeton High School.
Ownership History
Date
Name
Owned For
Owner Type
Purchase Details
Closed on
Sep 12, 2019
Sold by
Phs Global Llc
Bought by
Genesis Acres Llc and 39 43 Witherspoon Holdings Llc
Current Estimated Value
Purchase Details
Closed on
Jun 24, 2014
Sold by
Ckt Enterprises Llc
Bought by
Phs Global Llc
Purchase Details
Closed on
May 30, 2013
Sold by
Isal Huei Chu and Isal Cheng Kosern
Bought by
Ckt Enterprises Llc
Purchase Details
Closed on
Dec 24, 2012
Sold by
Chlfs Management Llc
Bought by
Ckt Enterprises Llc
Purchase Details
Closed on
Dec 18, 2012
Sold by
Ckt Enterprises Llc
Bought by
Chlfs Management Llc
Create a Home Valuation Report for This Property
The Home Valuation Report is an in-depth analysis detailing your home's value as well as a comparison with similar homes in the area
Home Values in the Area
Average Home Value in this Area
Purchase History
| Date | Buyer | Sale Price | Title Company |
|---|---|---|---|
| Genesis Acres Llc | $3,700,000 | Surety Title Company | |
| Phs Global Llc | $3,650,000 | Monarch Title Agency Inc | |
| Ckt Enterprises Llc | -- | None Available | |
| Ckt Enterprises Llc | -- | None Available | |
| Chlfs Management Llc | -- | None Available |
Source: Public Records
Tax History Compared to Growth
Tax History
| Year | Tax Paid | Tax Assessment Tax Assessment Total Assessment is a certain percentage of the fair market value that is determined by local assessors to be the total taxable value of land and additions on the property. | Land | Improvement |
|---|---|---|---|---|
| 2025 | $41,016 | $1,540,200 | $746,100 | $794,100 |
| 2024 | $38,721 | $1,540,200 | $746,100 | $794,100 |
| 2023 | $38,721 | $1,540,200 | $746,100 | $794,100 |
| 2022 | $37,458 | $1,540,200 | $746,100 | $794,100 |
| 2021 | $37,565 | $1,540,200 | $746,100 | $794,100 |
| 2020 | $37,273 | $1,540,200 | $746,100 | $794,100 |
| 2019 | $36,534 | $1,540,200 | $746,100 | $794,100 |
| 2018 | $35,917 | $1,540,200 | $746,100 | $794,100 |
| 2017 | $35,425 | $1,540,200 | $746,100 | $794,100 |
| 2016 | $34,870 | $1,540,200 | $746,100 | $794,100 |
| 2015 | $34,069 | $1,540,200 | $746,100 | $794,100 |
| 2014 | $33,653 | $1,540,200 | $746,100 | $794,100 |
Source: Public Records
Map
Nearby Homes
- 722 Avery Ln
- 721 Avery Ln
- 98 Nassau St Unit 3
- 132 Victoria Mews
- 20 Paul Robeson Place
- 49 Palmer Square W Unit D
- 48 Nassau St Unit I
- 30 Maclean St
- 57 Moran Ave
- 3 Harris Rd
- 74 Leigh Ave
- 54 Hodge Rd
- 87 Library Place
- 189 Moore St
- 82 Library Place
- 176 Bayard Ln
- 44 Murray Place
- 188 Bayard Ln
- 17 Aiken Ave
- 192 Bayard Ln
- 41 Witherspoon St
- 41.5 Witherspoon St Unit C
- 41.5 Witherspoon St Unit A
- 43 Witherspoon St
- 00 Spring St
- 41.5 Witherspoon Unit A
- 8 Spring St
- 0 Hulfish St
- 29 Witherspoon St Unit 35
- 29 Witherspoon St Unit 35
- 55 Witherspoon St Unit 502
- 55 Witherspoon St Unit 406
- 55 Witherspoon St
- 14 Spring St Unit 2F
- 14 Spring St Unit 1
- 14 Spring St Unit 2ND FLOOR
- 14 Spring St Unit 3
- 14 Spring St Unit 2ND FL
- 14 Spring St
- 34 Witherspoon St Unit 6